Special Situation Investing and Tube Investments of India

Special situation investing involves participating in variety of corporate actions like buyback, rights issue, demerger, etc. These are low-risk arbitrage opportunities which can act as kicker to investor’s core portfolio. In this blogpost, I am going to concentrate on demerger/spin-offs.

Demerger/Spin-offs happens for two broad reasons:

  1. Due to conglomerate nature or historical diversification steps, company could be operating in two completely different areas of businesses. Demerger/Spin-offs can help to get better valuation (no more holding company or conglomerate discount) and unlock parent company’s value. It also gives focused management bandwidth to each business to grow and scale up. Recent examples: Crompton greaves, Max India, and Transport corporation of India
  2. Sometimes, parent company might be struggling with debt, which holds back the core operating performance of the company. Hence, the management sandbag one of its divisions with debt and spin them off. This will liberate the other operating company from the debt and help them to achieve better valuation. Recent examples: Future enterprises became holding company with loads of debt and some investments in group companies whereas Future retail was spun-off with minimal debt. Same is the case with Sintex Industries where textile division had loads of debt and poor operating metrics when compared to Sintex plastics.

First category: It is a plain vanilla demerger but for some reason, Mr. Market mis-prices them even after the management’s demerger announcement. It usually takes 10-12 months from board approval to record date announcement. I believe Mr. Market underestimates what a focussed management bandwidth can do to the fortunes of the company. Market will offer an opportunity to enter these demerger stories at some point in time during this 10-12 months period.

Peter Lynch on Spin-offs:

“Spinoffs often result in astoundingly lucrative investments. Parent companies do not want to spin off divisions that will go on to fail as this would reflect poorly on the parent. Once these companies are granted their independence, the new management, free to run its own show, can cut costs and take creative measures that improve the near-term and long-term earnings. Spinoffs get little attention from Wall Street and they are usually misunderstood by investors. This all bodes well for future returns. Spinoffs are a fertile area for amateur shareholders. Lynch recommends looking for spin-offs with insider buying as it will confirm management believes in the spin-off’s long term potential”.

Second category: Sometimes, Mr. Market favor one business division much more than the other one. It could be due to high debt, small market capitalization, lack of complete information regarding the assets it holds. This will result in forced selling by the market participant. For example, a large mutual fund/FII’s mandate doesn’t allow them to hold companies more than 500 crores market cap. The discarded business division could be worth lot more than the current depressed price offered by market.

Howard Marks on Forced Selling:

“The absolute best buying opportunities come when asset holders are forced to sell, and in those crises they were present in large numbers. Believe me, there is nothing better than buying from someone who has to sell regardless of price. From time to time, holders become forced sellers for reasons like these:

  1. The funds they manage experience withdrawals
  2. Their portfolio holdings violate investment guidelines
  3. They receive margin calls because the value of their assets fails to satisfy requirements agreed to in contracts with their lenders”

Joel Greenblatt on Spin-off:

“Believe it or not, far from being a one-time insight, tremendous leverage is an attribute found in many spinoff situations. Remember, one of the primary reasons a corporation may choose to spin off a particular business is its desire to receive value for a business it deems undesirable and troublesome to sell. What better way to extract value from a spin-off than to palm off some of the parent company’s debt onto the spin-off’s balance sheet? Every dollar of debt transferred to the new spinoff company adds a dollar of value to the parent.

The result of this process is the creation of a large number of inordinately leverage spinoffs. Though the market may value the equity in one of these spinoffs at $1 per every $5, $6 or even $10 of corporate debt in the newly created spin-off, $1 is also the amount of your maximum loss. Individual investors are not responsible for the debts of a corporation. Say what you will about the risks of investing in such companies, the rewards of sound reasoning and good research are vastly multiplied when applied in these leveraged circumstances. Tremendous leverage would magnify our returns if spinoff turned out, for some reason, to be more attractive than its initial appearances indicated”

Seth Klarman on Spin-off:

“The behavior of institutional investors, dictated by constraints on their behavior, can sometimes cause stock prices to depart from underlying value. Institutional selling of a low-priced small-capitalization spinoff is one such example. Many parent-company shareholders receiving shares in a spinoff choose to sell quickly, often for the same reasons that the parent company divested itself of the subsidiary in the first place. Shareholders receiving the spin-off shares will find still other reasons to sell: they may know little or nothing about the business that was spun off and find it easier to sell than to learn; large institutional investors may deem the newly created entity too small to bother with; and index funds will sell regardless of price if the spinoff is not a member of their assigned index. There is typically a two to three month lag period during which the spin-off company’s financials have not been entered into financial databases and there will be very few analysts covering it. Thus, the stock could be the cheapest stock in the world during this time”

Historical data both in India and around the world points to better performance of spin-offs when compared to broader markets.

Empirical data on Spin-offs globally:

Screen Shot 2017-07-09 at 7.42.26 PM

Empirical data on Spin-offs across market cycles in India:

Screen Shot 2017-07-09 at 8.56.06 PM

Screen Shot 2017-07-09 at 7.42.13 PM

My experience:

I have very limited experience in the demergers space. I started to focus on this segment for the past 3 years with reasonable success. Following are some of my experience:

  1. Crompton Greaves: Demerger of Consumer electrical division from parent CG power. Crompton was a very powerful brand in consumer electricals but management couldn’t focus, invest and grow the brand due to the distraction of poor operating performance of CG power overseas division. Management announced demerger and at the same time sold their stake to PE funds (Advent International and Temasek holdings). I believed new management can realize better value than the current management. Meanwhile, they appointed Shantanu Khosla as new MD who is veteran in P&G India signalling change in management focus. Hence i bought them between Jan and Feb 2016, with a simple assumption that new management focus can help to create better value for the Crompton brand. Investment worked out lot better than i initially thought. 
  2. Transport Corporation of India: Demerger of TCI express division which caters to e-commerce verticals. Here both the parent and the demerged entity were equally good. Most Indian promoters has many children. In order to avoid conflict and give them better autonomy, promoters will demerge business division so that each children can steer an individual company better and scale them up. TCI and TCI express is a straightforward demerger. I bought 2-3 months before the record date for demerger and both equally performed well over the past one year.
  3. Future Enterprises: This was not my original idea. One of my friend shared his short thesis on the company: “Future enterprises is Complex spin off. Top 3 shareholders are ‘Consumer funds’ who are now forcefully selling the ‘Rental & Investment spinoff’ as it’s not in their mandate to hold non consumer stocks. Value of Investments (in Future lifestyle, Future Consumer, Logistics division, Insurance division) exceeds total debt. Management has promised to monetise assets and pare debt quickly which is key. Process has already begun. While the rental business is available free. Expecting huge cash flow from this business in coming quarters. I think the stock is worth more than CMP. Pure holding companies trade at discount but here management is planning to monetize the assets and pay off the debt. Hence value will migrate from debt side to equity side”. 
  • After reading his note, I looked at the shareholding pattern of the company. The amount of forced selling by FPI consumer funds was staggering. They wanted to get rid of their positions in the holding company before December year-end closing for investor’s reporting. Check out the following table:

Name of FPI

Mar’16 June’16 Sep’16 Dec’16

Arisaig India Fund

8.14%

7.32% 6.41%

<1%

WGI EM Fund 2.77% 2.49% 1.12%

<1%

Based on the above info and company’s presentation’s, I bought Future Enterprises in Dec’16 and the investment turned out very good.

Timeline of demerger process in India:

Untitled

[From a company’s presentation: Timeline is little optimistic (usually it takes 10-12 months instead of 8 months mentioned above). Just added to give an idea on steps involved in the process].

Demerger opportunities currently open:

Screen Shot 2017-07-09 at 6.31.18 PM

My thoughts on Tube Investments of India demerger:

As we can see from the above table, Tube Investments of India board announced demerger of manufacturing vertical from financial services on Nov 3, 2016 and currently it is close to getting NCLT approval. Record date would be around Sept 2017 and further listing of the demerged entity would be around Nov 2017. It is part of Murugappa’s group. Management is known for competence and integrity.

Screen Shot 2017-07-09 at 6.52.49 PM

Recent company’s presentation is very informative. Have a look. 

I did valuation analysis on July 1, 2017. Market cap = 12,500 crores.

Financial vertical = approximately 10,000 – 11,000 crores.

  1. Holds 46% stake in Chola finance. At CMP, it comes to 8000 crores. Let’s apply a holding company discount of 25% = comes to 6000 crores.  
  2. TII holds 60% stake in Chola MS general insurance business. It is one of the better managed and consistently profit making general insurance business in India. Got captive customers in Chola finance for selling general insurance policies. In addition, in recent times, government opened up agri insurance business which gives more business opportunity for general insurance companies.
  3. None of the general insurance companies are listed. Hence we have to rely on secondary market valuation. In March 2016, TII sold 15% stake to Japanese JV partner Mitsui at a valuation of around 6500 crores. TII’s 60% stake comes to 3800-4000 crores. Demerger will happen sometime around August, 2017. Hence 18 month forward, one can assign 5000 crores. FY’17 TII’s 60% share of profits = 125 crores (growth of 60% over FY’16). For FY’18, i expect this division to post 155-160 crores (25% growth). 5000 crores valuation assigns around 30-32 PE which is reasonable considering general insurance business potential and scores of planned IPO listing in this space in FY’18.

Manufacturing vertical = approximately 4000 crores:

FY’16 Revenues = 4000 crores; EBIT = 260 crores (margin 6.3%).  FY’17 revenues of 4200 crores & EBIT of 310 crores (7.3%). Most of the capex is done. FY’17 volumes of cycle division suffered little bit. Economic revival & better capacity utilization can push up the EBIT margins to 9-10%. Even if we value at 1X revenues/12X EBIT, its valuation approximately comes to 4000 crores. Got a debt of 650 crores – which is manageable given the cash flows.

Above calculation shows that roughly there is 25% valuation gap. I can see 2 trades here. First opportunity: Buy close to the NCLT verdict and hold for 12-18 months for decent returns. Another opportunity could be: After listing, market for some reason could favour finance division much more than manufacturing division and that can result in temporary mispricing which can be good entry point for decent returns. 

Recent development: Murugappa group has a policy of rotation of CEO among various business divisions so that they don’t get attached to the business and mistreat it as their fiefdom rather than being a team player in the overall group activity. Group appointed Vellayan Subbiah as MD for Tube investments of India. He successfully turned around the Chola finance business over the past 5-6 years from their slumps. I believe this can booster dose for the better profitability of manufacturing vertical of Tube investments (Just a guess). Have a look at his profile

Conclusion:

There is no single scientific reason/valuation metric behind better returns in demerger/spin-offs. It could be due to multitude of factors like better market perception, better management focus, better valuation due to forced selling etc. One additional indicator I track is insider’s behaviour. Sometimes, promoter will buy from open market or allot warrants indicating their intention to raise stake in these companies. I know that in the current red-hot market where small caps are flying thick & fast, average returns of 20-25% wont appeal to lot of people. But i still believe that investing around the special situations like demerger carries minimal risk and it is a useful tool to have in the portfolio. 

However, everything is not rosy in the world of demerger. In recent times, IDFC bank demerger is one example where some of my friends made zero returns. Sometimes, management cancels the whole demerger process (Eg: Jasch Industries). Hence, it is important to pick and choose the company we want to associate with. 

Resources:

  1. You can be a stock market genius – Joel Greenblatt [Chapter 2: Page # 53-128]
  2. Margin of Safety – Seth Klarman [Chapter 10: Page # 187-191]
  3. One up on wall street – Peter Lynch [Chapter 8: 133-136]. 
  4. SBI Capital Securities on demergers in India – Link 
  5. Axis Capital research report on Tube investments of India – Link 

Disclaimer: Please note that this is my investment journal. The main aim is to expose my investment thoughts to the scrutiny of fellow investors and improve the process thereby. It shall not be construed as an advise to buy/sell the stock.

RBL bank and ESOPs

Unlike manufacturing companies, capital is the raw material for financial institutions. Banks periodically raise capital by issuing new shares via rights issue, QIP etc. to support their future growth. Hence, for existing shareholders, equity dilution is one of the important factor that impacts his/her future returns. In addition, Equity stock option (ESOPs) to the top management is another important factor that dilutes investor returns. Check out the difference in CAGR returns between net profit growth and Earnings per share for some of the best-performing private sector banks. On average, 3-5% impact on the returns can be seen.

screen-shot-2017-02-20-at-8-18-56-pm

RBL Bank was kind of outlier – I convinced myself that this could be due to the huge capital raised by the new management to support their high-growth phase (Before IPO, they raised capital from marquee investors via multiple private placement of shares). However, following figure from Motilal Oswal research report intrigued me:

screen-shot-2017-02-21-at-12-18-38-amHigh-powered Incentives:

Around the world, the behaviour of the management teams usually responds to financial incentives. It is one of the most powerful concept in behavioral economics. Charlie Munger stressed that one should always think about the power of incentives. He famously quipped, “Show me the incentive and I will show you the outcome”. In recent times, ESOPs issuance by Indian private sector banks emerged as an most important component of management compensation and retention tool. It was pioneered by HDFC bank and over the time, most private banks followed the suit.

Check out the following two passages on incentives:

screen-shot-2017-02-21-at-2-30-21-pm

[Source: Morgan Housel’s post titled “The Double-Edge Sword of Incentives“]

screen-shot-2017-02-21-at-2-37-38-pm

Source: Ajay Shah’s post on “High-powered incentives in banks

Opaque accounting practices in financial sector:

Complex accounting practices of financial sector places enormous power in the hands of the senior management in terms of what kind of information to disclose in financial statements. There are many instances in India where opaque accounting and senior management’s aggressive loan growth strategy leading to near-term bank profits that could boost the stock price today but damage the business few years down the line.

  1. Read Livemint story on the aggressive lending of Indian Overseas Bank
  2. Read Outlook business story on wholesale banking business troubles of Standard Chartered bank in India

In the year 2013, ambit capital came out with a thematic report on aggressive accounting policies followed by Indian companies. It flagged following two accounting practices regarding private sector banks:

I. Cost of ESOPs [basically management compensation cost] is not expensed in the bank’s P&L statement using a proper valuation method and hence boosting bank’s profitability. It further noted that if ESOPs are properly expensed, it would shave off 10bps from ROAs of these banks. screen-shot-2017-02-21-at-12-56-30-am

II. Fee income accounting: Fee income constitutes significant portion of private bank’s operating revenues. While the interest paid by borrower accrues over the duration of the asset, the fee income is often booked upfront by some of the banks, thus bloating the earnings. Check out the following example from the report:

screen-shot-2017-02-21-at-12-56-56-am

RBL bank and ESOPs:

Annual reports does not provide much info regarding fee income accounting. However, there is fair amount of disclosure on ESOPs and its impact of bank’s profitability.

screen-shot-2017-02-21-at-3-04-48-pm

[Source: Annual report FY’16]

I looked up info on ESOPs impact on profitability from previous annual reports and compared with the IndusInd bank [Where MNC executives took over the bank’s top management in 2008].  screen-shot-2017-02-21-at-3-15-54-pm

Bottomline impact is consistently on the higher side. I also looked at the outstanding options at the end of FY’16 and compared it to total equity base. It shows the prospect of significant equity dilution going forward when compared to other private banks. screen-shot-2017-02-21-at-12-05-55-am

I have high regards for the senior management of RBL bank for turning sleepy co-operative bank into new-age private sector bank. Its IPO was well-marketed. But i feel, the compensation structure is bit unfair to the equity shareholders of the bank. I agree that ESOPs across the management structure could instill a sense of ownership and motivates them to strive for better organization. However, this high-powered incentives has the potential to act as a distraction for the management to build a robust financial firm.

P.S. I have a friendly bet against RBL bank with a friend initiated on October 1st, 2016. I wagered that DCB Bank will outperform on a 3-year term basis when compared to RBL bank. My bet was purely based on the valuation when compared to its CASA deposits, return ratios, loan book basis etc. I still believe that if management executes quality growth, it can outperform most private banks on a 7/10 year horizon. However, I would like to keep a close eye on the behavior of the management.

P.P.S. Why does the bank schedule so many analyst meet? Almost like an daily affair 🙂

Disclaimer: Please note that this is my investment journal. The main aim is to expose my investment thoughts to the scrutiny of fellow investors and improve the process thereby. It shall not be construed as an advise to buy/sell the stock.

Kiri Industries – Heads I win; Tails I don’t lose much

Mohnish Pabrai in his highly acclaimed book ‘Dhandho Investor’ popularized the following concept:

  • Investors should constantly look for mis-priced situations where loss on downside is capped while potential upside is multi-fold (Heads I win, Tails I don’t lose much).
  • One must bet big when the odds are overwhelmingly in his favor.

While screening for bargains in Chemicals industry (If you want to make the industry sexy, then add “Specialty” before it :-)), I accidentally stumbled upon Kiri Industries.

screen-shot-2017-01-03-at-1-54-10-pm

Background:

Kiri Industries is one of India’s largest and integrated manufacturer of dyes intermediates and reactive dyes which are used in dyeing cotton fabrics, synthetic fabrics, bed-sheets, carpets etc.

Value chain: Basic Chemicals [Oleum/Sulphuric Acid/Chloro Sulphonic Acid] —> Dyes Intermediates (Vinyl Sulphone/H-Acid) —> Reactive Dyes (Colorants for Textiles). The company is vertically integrated across the value chain from basic chemicals to reactive dyes.

I. Rapid rise (2007-2011):

Manish Kiri (2nd gen promoter with MBA from USA) took over the company.  This period was marked by rapid expansion of manufacturing facilities, overseas acquisition, equity fund raising via IPO & QIP and debt binging.

  • In March 2008, company came out with the IPO to raise about 56 crores. The funds was principally meant for capacity expansion of basic chemicals and dyes intermediates.
  • In March 2010, Kiri industries (37.57% stake) formed a JV with China-based Longsheng group (62.43% stake) and acquired German-based DyStar from bankruptcy proceedings. The JV was based out of Singapore and raised about 100 million euro (Debt to equity of 65:35) to fund the acquisition. DyStar (Formed through the merger of dyes operations of BASF, Hoechst, and Bayer) is a leading player in dyes solutions with a 21% global market share and with sales of 800 million euro. It acquired the net assets of 291 million euro in addition to fully depreciated fixed assets of 140 million euro at replacement value. It avoided taking over all liabilities, including employees and bank liabilities in Germany.
  • In November 2010, Kiri industries raised about 240 crores at the price of 590/- to fund DyStar acquisition and also expand manufacturing facilities of standalone business.

During this period, revenues of standalone operations jumped 4X to 572 crores. However, debt also jumped from 60 crores to 410 crores.

screen-shot-2017-01-03-at-4-29-21-pm

screen-shot-2017-01-03-at-4-33-00-pm

II. Hard fall (2011-2015): 

  • Delay in turnaround of DyStar: Initial turnaround plan was to replace high cost german manufacturing base with lost cost manufacturing in India & China and be cash positive from 2011. Management also guided DyStar IPO by Q1 CY 2013 at an international market. Even the best laid plans goes awry due to multiple factors. Euro zone crisis and resultant slowdown hit DyStar hard. Hence, Kiri Industries had to fund the company through term loans & working capital loans (around 100 crores) raised in foreign currency in FY’12.
  • Derivative loss: During the Rupee crisis in 2013, Kiri Industries encountered derivative losses (82 cr) and loss on conversion of foreign currency loans to Indian currency (30 cr) following restructuring of loans by banks [Similar to many Indian firms at that time who didn’t hedge foreign currency]. All of them piled into giant debt of 750 crores!!
  • Volatility in crude oil prices (principle raw material) and dumping from Chinese competitors [Unlike Indian counterparts, Chinese manufacturers do not have effluent treatment plant – hence they could produce at low cost]  resulted in losses even at operating levels [Closest competitor Bodal Chemicals also faced similar problems – suffered both operational & forex loss].screen-shot-2017-01-03-at-5-52-30-pm
  • Corporate Debt Restructuring: Shares pledged with the lenders were dumped in the market resulting in drastic drop in promoter shareholding from 58% to 30%. Also, JV partner blocked the IPO of DyStar and thereby preventing value unlocking. Local banks also closed funding tap following the debt ballooning & operational losses. Hence, the company ran out of options and admitted into CDR.

III. Slow Recovery (2015-Present):

When the company is headed south, we investors have an option to abandon the ship and move to better investment opportunity. However, promoters does not have that luxury. His fortunes are intimately tied with the company. He has to wither the storm and do the hard grind to reach his desired destination.

  • Promoter fund infusion: In FY 2015-16, promoter infused around 50 crores in 2 tranches by subscribing to 37.5 lakh warrants at 135/- per share. Consequently shareholding increased from 25 to 37%. In October 2016, board approved 35 lakh warrant to promoters at the price of 363/- which can be converted at any time during the next 18 months. At the time of allotment, promoter has to pay 25% upfront i.e. 32 crores. Promoter shareholding may jump to 44.64% at the end of the process. Warrants at both instance were priced at slight premium to the prevailing market price. As of date, they infused 80 crores along with commitment of 90 crores over the next 18 months.
  • Debt restructuring by lenders: In exchange of promoter’s fund infusion, lenders agreed to restructure the debts. April 2016 announcement: “Kiri Industries Limited has executed agreements for settlement of all its debt by the end of financial year March 31 , 2016. This has resulted in significant reduction of the borrowing. The total borrowings of the company have been reduced from Rs. 853.13 crores to Rs. 410.62 crores, which is about 51.87% reduction compared to the previous financial year. The initial installments under the agreements are also paid before the end of the financial year 2015-16. Further, as per Settlement Agreements executed, the Company is committed to settle and repay majority of the balance debt during the current Financial Year 2016-17. Hence, the company has now achieved a major landmark for its shareholders by fully addressing its debt burden, which had been weighing down the Company’s performance over the past several years. On one hand the realization of its products have significantly improved, on the other hand there would be huge savings in the finance charges from the current financial year i.e. 2016-17. The debt has been addressed majorly with the asset reconstruction companies, private lenders, as well as NCD holders.”
  • Tailwind for Indian dye intermediates manufacturers: Closure of chinese plant (Hubei Chuyuan – Largest player of Dyestuff in China) resulted in 2-3X increase in prices of dyes intermediates (Vinyl Sulphone/H-Acid) resulting in windfall gains. In addition, Indian dyes industry faces structural tailwind due to china’s pollution problem (See below).

Heads I win – Value unlocking in Dystar subsidiary:

Beginning FY’14, DyStar subsidiary started to show turnaround in performance and is now generating profits consistently for the past 3 years. This associate profit from the JV gives an EPS of 70-80. Principal reason for the low PE in the screening table above is that Mr. Market ignores DyStar associate profit completely. With no access to the DyStar profit pool, Mr. Market believes that Kiri’s investment became kind of dead-end.

screen-shot-2017-01-03-at-9-14-12-pm

In June 2015, Kiri Industries initiated legal proceedings in the High Court of Republic of Singapore against JV partner Longsheng to enforce its rights as a significant minority shareholder and unlock value of the company’s share (37.37% stake) in DyStar.

Company is hopeful of completing litigation by end of Sept’17. Based on the timeline of recent Daichi-Ranbaxy arbitration at Singapore court, I would say it is very much possible. Also remember, JV (DyStar global holdings) entity was registered in Singapore.

screen-shot-2017-01-03-at-9-46-32-pm

Daichi – Ranbaxy arbitration timeline

Best-case scenario: If Kiri Industries win in litigation, then JV partner has to purchase its 37.37% stake on the basis of court mandated independent valuation or else to liquidate DyStar and distribute assets as per investment ratio of both shareholders. Even if we assign a PE of 10-12, its 37.37% stake will yield around 2000 crores.

Worst-case scenario: Company’s investment will remain blocked till it liquidate to a 3rd party.

Tails I don’t lose much:

  • Industry tailwind for the standalone operations:

screen-shot-2017-01-03-at-7-38-11-pm

[Source: Bodal Chemicals Investor’s presentation]

screen-shot-2017-01-03-at-7-38-38-pm

[Source: Bodal Chemicals Investor’s presentation]

  • Quarterly performance in FY’2017:

kiri-quarterly

On a steady-state basis, company should yield around 70-80 crores of net profit [Note: Quarterly interest cost fell from 20 cr to 2.5 cr]. At a PE of 10-12, standalone operations of Kiri Industries should support the current valuation of 900 crores.

Management:

Ultimately we are partnering with promoters in a belief that they will share the proceeds with minority shareholders. Hence listed factors for & against promoters:screen-shot-2017-01-04-at-12-11-31-am

Concentrated bet can go wrong:

I strongly believe that few outsized bets are necessary to build a sizable corpus before switching to diversified portfolio to protect the corpus. Once a favorable odd was identified, we have to gather courage to bet big. If everything goes well, investment should conservatively yield 3X in 2-3 years time frame. If not, will incur huge opportunity costs due to the outsized nature of the bet.

Worked: Buffet invested of 40% of his fund in American express during salad oil scandal.

Went against: Bill Miller investment in Financials during 2008 crisis and Bill Ackman’s investment in Valeant pharmaceuticals.

Disclaimer: Please note that this is my investment journal. The main aim is to expose my investment thesis to the scrutiny of fellow investors and improve the process thereby. It shall not be construed as an advise to buy/sell the stock.

Indian Financial Landscape through the eyes of Rashesh Shah (Edelweiss)

This blog is mostly about recording and sharing ‘aha’ moments which i come across while studying various businesses in Indian stock market. This post is about things that i learned about Indian financial space accidentally while analyzing Edelweiss financial services.

Background:

Barring few exceptions, most consistent wealth creators in India are generally limited to 4 sectors: Information technology, Pharmaceuticals, Financials, and Consumer facing branded companies (2&3-wheelers, FMCG, housing-related etc.).  However, IT and Pharma are going through their fair share of churn in their business models.

IT – I may be the 100th person 🙂 to tell you about the coming disruption of Social, Mobile, Analytics, Cloud (SMAC) to the business model of IT companies. Besides, top 3 sectors serviced by Indian IT companies are undergoing tremendous change and managements are struggling to adapt to them. For eg: Banks & Insurance companies are struggling due to negative interest rates & regulatory changes; Hardware IT companies like Dell, HP, Intel, Cisco are finding tough to match cloud services; retail companies like Macys, JCP, Belk, Target due to the E-Commerce onslaught from Amazon.

Pharma – It is not the FDA issues that am worried about. I strongly believe in, “what doesn’t kill you, will make you stronger”. FDA concerns will stregthen well-managed companies. But am worried about something else. Neelkanth Mishra of Credit Suisse pointed out in an interview: “Earlier, Pharma companies are valued for base business + one-off cashflows discounted back. However, now one-off bounties are included as regular cashflows and valued accordingly”. Besides there is no visibility for blockbuster drugs going off-patent beyond FY’18-19.

Hence, understanding financials is very important and you cant ignore the biggest wealth-creating segment. This blogpost is an on-going effort to learn the business model of financial institutions in India.

According to me, there are 4 broad themes playing out in financial services:

  1. PSU banks which control 70% of the credit are sitting ducks and one of the greatest value migration happening right in front of us.
  2. Technology and competition from new licensed players will disrupt both the payments space and retail savings part. We already saw record mobilization of funds by Bandhan Bank at higher interest rates.
  3. But risk pricing can’t be disintermediated by technology in my opinion. It is not the technology part that is harder. Human short-term greed is the problem.  You need an fanatic manager who eschews short-term greed and pressure from PE players & truly focus on the long term vision of the business. Until that happens, you will hear stories like Lending Club, P2P scams in China etc. and people will develop mistrust about the platform.
  4. Over the long-term, net interest margins for Indian financial players could come down due to the technology and competition. Hence, am very vary to pay high price to book multiples.

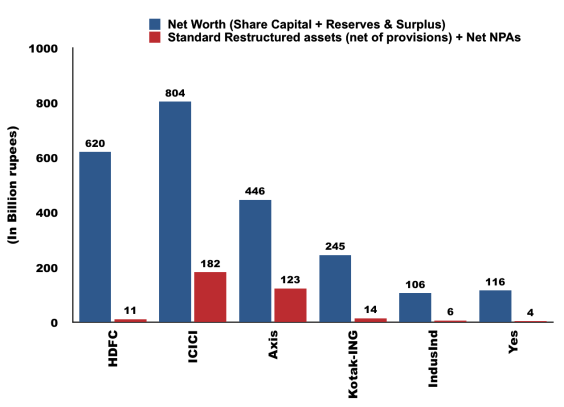
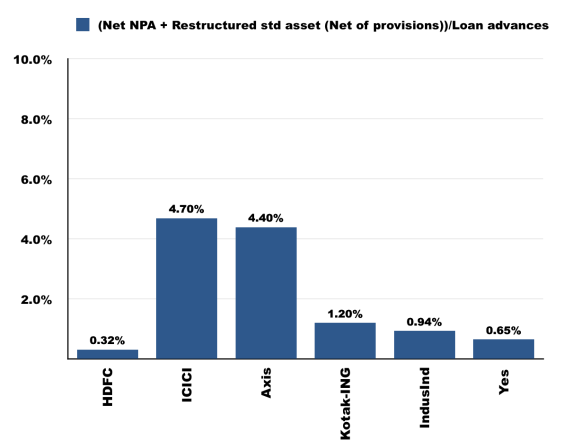
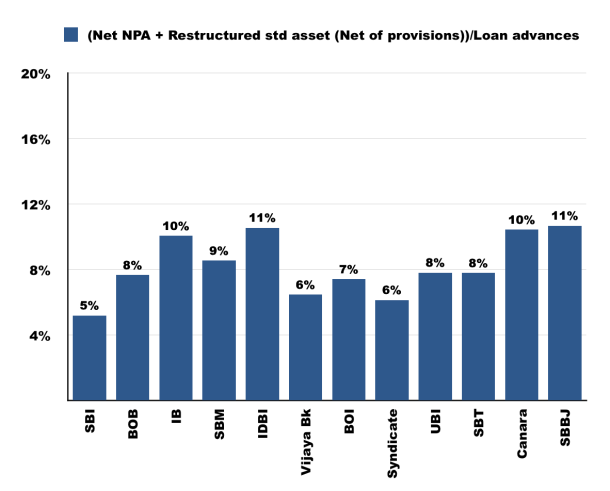
As I analyzed in earlier blogposts (Part-I & Part-II), most PSU banks, and old-age private banks are in deep troubles due to NPA. As a next step, I wanted to study about NBFCs. It can be largely divided into 5 groups:

  1. Retail loans like Auto, Gold, & Consumer loans – Bajaj, Shriram City, Shriram Transport, M&M financials, Sundaram, Chola finance, Muthoot finance, Manappuram, Capital first, Magma Fincorp.
  2. Housing finance companies – HDFC, GRUH, Repco, Canfin, Indiabulls, Dewan, LIC, GIC housing.
  3. Microfinance/Small finance banks – Ujjivan, Equitas, Satin, SKS, Arman Financial.
  4. Broking companies diversifying – Edelweiss, Motilal Oswal, IIFL holdings, JM financials.
  5. Industrial conglomerates building NBFCs – Religare, Reliance Capital, L&T financial, Piramal Enterprises, Aditya Birla financials.

As usual, I followed the process of exclusion to focus down the players i wanted to study. I believe there is some kind of frothiness in terms of future business expectation and valuation going on in housing finance & microfinance space. As management is the top filter to invest in leveraged business like financials, I avoided both broking companies (due to their involvement with NSEL scam) and Industrial conglomerates (for their poor corporate governance & capital allocation abilities except in the case of Piramal Enterprises). However, following passage from Forbes India intrigued me about the Edelweiss financial services.

CpjKUPeVUAAQNm-

Prudent risk management kept Edelweiss away from NSEL fiasco when other leading brokers like IIFL, Motilal etc. burnt their fingers & reputation. Hence, i wanted to dig deeper about the company.

Edelweiss Financial Services:

According to me, basic smell test for any company is ROE and growth >15%. It passed on both counts.

Screen Shot 2016-08-24 at 10.37.49 PMScreen Shot 2016-08-24 at 10.37.06 PM

Business model:

Their quarterly presentation gives very good idea about their various business lines. It is present in both credit side (NBFC) and non-credit side (like Insurance, asset management, wealth management, Investment banking etc.).

My view:

It has got fairly good presence in wholesale credit segment, Asset reconstruction credit, Investment banking, Agri warehousing . However, their retail NBFC, Insurance, Wealth management segments are still in the investment phase and long way to go before contributing meaningfully. On the consolidated basis, only in Q1 FY’17 they crossed ROE of 15%. We have to look for the cosistency of ROE, ROA, and how various platforms are scaling up.

However, this post is not about the analysis of Edelweiss financial services. It is more about things i learned about the Indian financial space from its Investor day transcript. It was an excellent talk from the CEO Rashesh Shah. I made few edits for my understanding and grouped interesting parts of the talk into 3 segments and various sub-segments (I strongly recommend interested people to read the 32-page original transcript which is full of insights about the Indian financial space).

I. Overview of Indian credit market

II. About business model of financial institutions

III. About Edelweiss business lines

I. Overview of Indian credit market:

Three broad trends happening in the Indian credit market:

  1. Credit markets are getting segmented and new avenues opening up
  2. New avenues for capital/liabilities opening up
  3. From the risk management point of view, more data or information is available with info from credit bureaus and analytics

Bird’s eye view of Indian credit market:

Even today the total credit outstanding in the entire banking sector is about Rs. 75 lakh crore out of which about 52 is with the PSU banks and 22-23 is with the private sector banks. The total credit of all the non-banks put together is only Rs. 8 lakh crore only. So it is a smaller base and even within that there are the larger NBFCs who are mono lines focused on a particular segment. Out of Rs. eight lakh crore at least Rs. 4.5 to 5 lakh crore is housing finance. So the non-housing finance is only Rs. 3-4 lakh crore in the non-bank markets. So if you keep on slicing like that you can estimate that there is at least a fair amount of opportunities are still available.

Credit markets getting segmented & newer segments opening up:

Pre 2000 there was hardly any retail credit market in India. We had few housing loan products, and a few auto loan products but the retail credit as we all know now, it did not exist. For the first 8–10 years when ICICI Bank, HDFC Bank all of them started ramping up the retail credit part of the opportunity, it was still largely in the urban areas, largely in the metros and also largely to salaried employees of the companies. However, over the last 7-8 years, the credit market became very heterogeneous and there are smaller and smaller segments of credit which are starting to open up. Recent times, many NBFCs have seen good growth in segments like auto loans (2-wheeler, 3-wheeler, tractor, commercial vehicles – LCV/HCV) to rural markets, micro finance companies, SME Sectors, Self-employed where earnings are erratic and where there is no clear salary certificate etc. Also the credit bureau getting setup, and now with analytics you can have a fairly good estimate of cash flow. This is a completely new market, which has opened up.

Market is getting segmented which happens with every new entrant. So if you see consumer goods in India, there was one detergent out there. Then suddenly Nirma, Rin and Wheel and a lot of others came about. As the market is growing the segment doesn’t remain static. So like the SME segment itself has at least 8-9 categories from equipment finance to what is called UBL – unsecured business loans, to SME secured, to trade finance, to various other categories. And SME itself has got micro SME’S where the average loan size is about Rs. 8-10 lakhs, to SME’s where your average loan size is about Rs. 30-40 lakhs, to mid SME’s where your average loan size is a crore, to large SME’s where it can be up to Rs. 5 crore. And these are very very different categories – their needs, their banking experience, their track record, and the information available about them are very very different. So if you saw in housing also, companies like Repco, Gruh and all grew because they went after the self-employed segment, which was not there earlier. Until 8-9 years ago people were not actually going after that because of lack of enough underwriting data or the analytics or the credit bureau information. So now what is happening in credit is newer segments are opening up. For the newer players, a thousand, two thousand or five thousand crore rupees market segment is also exciting, while for an existing large player it may not be. And third is when you become large and if you have been doing a particular asset class it is very hard for organizations to change, especially for mono lines becoming multi line is very hard. If you see Bajaj Finance is not a monoline, they are now multiline. Their real growth started the day they removed auto finance from their name. It used to be called Bajaj Auto Finance, and then the day Auto was dropped is when the growth started happening. Going after the new emerging opportunities you should be able to go after multiple, smaller opportunities where you can learn the game. You have to be agile, have to be slightly more adaptable, which may be the new age firms are.

Bank Vs NBFC debate:

The pros about a bank is that you can choose your scalability because if there is a glass ceiling on NBFC at Rs. 100,000 crore and if you really want to think about the next 10– 15–20 years and at some point you want to be Rs. 2 lac–3 lac crore, then you need to think. It is currently hard to see an NBFC scaling up more than Rs. 100,000 crore but as I said it keeps on changing. 10 years ago I would have said Rs. 20,000 crore; 3–4 years ago I would have said Rs. 40,000 crore, now I am saying Rs. 100,000 crore is the glass ceiling for NBFCs. The other thing that the banking structure will allow you is some more stable regulatory environment because a non bank is always exposed to RBI changing its view on NBFCs and we have seen that happening over the years. The last 3 years RBI has been very positive about NBFCs but it can easily change if there is some chaos in the industry. So you are always suspect to scalability issues and the change in the regulatory environment if you are a non bank. On the other side what has happened is the profitability of the non-bank has improved as compared to banks. As I keep on saying, how many banks you can name who have RoE above 18% and how many non banks you can name who have RoE under 18%?

Liability side is getting broad based:

The biggest problem to be in the credit business is you need capital and it is not the asset side problem, it is the resource side. The liability side problem is bigger. It is very hard for a non-business group to build the resource side of the equation. The asset side work will always be there. What has changed in the last 3 years is the resources side has become lot more easier for NBFCs. Lot of the older firms was able to grow because they had access to bank relationships and other funding options. The bank credit as a percentage of their borrowing is starting to fall as the bond market is starting to develop. There are a lot of new players in that, for example insurance companies are becoming a big supplier of credit to the NBFCs. It was always earlier banks, and then mutual funds started after 2008-09 when they started getting some scale. But in the last three years insurance companies are emerging and I can guarantee you that in the next five years insurance companies are going to be big provider of capital, long-term capital to the NBFCs. An insurance company on a traditional policies will allocate 85-95% of the money in bonds and only 5-15% in the equities. So all that is starting to change and so I am saying that liability side change is very exciting. A lot of more NBFCs, which are not constrained by resources, are now starting to take advantage of.

II. About business model of financial institutions:

What can kill you in credit business?

But as with everything in credit, you have to be very careful, you have to focus on cost, at underwriting cost. Your underwriting costs are the most important cost in this business. What can kill you in a credit business is your credit cost, it is not going to be your cost income ratio, and it is not going to be your cost of funds. If you are reasonably smart, it is okay. But if you can get your credit cost down and keep them under control then there is a huge opportunity.

Mono-line vs Multi-line:

Most NBFCs are fairly mono lines (either in housing finance or commercial vehicle or gold loan) and what we have found is if you look at the NBFC’s history in India, monolines grow very fast but also struggle across cycles because if you are a housing finance company and you think there is a lot of irrational stuff going on the financial industry and people are under pricing, will you be able to scale back the business? It is very hard to do because how do you give up growth? No credit company will be ok with the shrinking book. So you will continue to grow hoping that I will be smarter than the others, but you will not be able to escape the irrationality of the industry. However, if you are a broad base firm, which what the banks are, you can keep on reallocating your portfolio. Aditya Puri once remarked to me that when the auto finance industry got very irrational, there was a lot of undercutting going on and HDFC Bank scaled back, actually exited the auto finance business completely for 4 years and then they came back after that. Now if you are at HDFC Bank you have that option, but if you are only an auto finance company do you have that option? You have the sales force, you have all the relationships with the dealers and you can’t escape that. You can slow it down but you can’t escape that.

Lack of size is an advantage:

Finding a new niche is a lot harder for larger banks. For example, microfinance companies like Equitas or Ujjivan is happy to build a Rs. 4000–5000 crore book over 8 year and be happy over that. But it is hard for a bank to say that I am going to spend 8 years figuring out the micro finance market and build an 8–10,000 crore book though it can be very profitable. The scale is actually starting to work against them in new emerging opportunities. So while we are seeing these untapped segments in the credit market, each of them is at a size of where it is exciting for building a 3-4-5-7 or 8000 crore book. But you can’t build a Rs. 30 – 40,000 crore book in any one segment. Lack of size is an advantage because we can go after smaller and niche opportunities and you have seen a lot of other NBFCs and the credit firms have also gone after that. The only bank who has done this very well is the HDFC Bank. It is the only bank which will a see Rs. three thousand crore opportunity and go after it. So whether it is gold loan or a micro finance loan they are not leaving that behind. So amongst all the banks it is the only bank I have seen which can go after this sub scale opportunities and build expertise in that and that been the magic they have. Twenty years ago when the broker accounts was a small part, the first one to maintain and build that line was HDFC Bank and their ability has been to go after the smaller segments.

Lessons from 2008 retail loan crisis:

Even in 2008 when there was a retail banking crisis, 80% of that was in small ticket personal loan, what is called STPL, that time and everybody from GE Capital to Fullerton to ICICI to HSBC everybody had a large part of STPL book and there was craziness because the same guy was actually borrowing from 8 people. You didn’t have the credit bureau then and in fact people like Bajaj benefited out of that unsecured market collapse as everybody emptied out of that space except the HDFC Bank. So if I go back to 2011, the only players left in unsecured consumer loans were HDFC and Bajaj. Idea in credit is to pick up early warning signal like we ourselves have gone and analyzed the 2008 STPL market and there were 2 – 3 firms which really got stressed. But you know large part of stress happened when everybody else slowed down and scaled back, they continued for 3 more quarters and the 3 more quarters was what actually killed them. So the idea is to see the early stress and scale back which is what I keep on emphasising and lot of our risk focuses on analytics and we work with CIBIL and everybody else to see that stress.

Scaling back is very important in credit business:

One good thing about credit markets in India is that there have been pockets like STPL in 2008, Project finance now and project finance in 89–90–91, 2000–2001, 2002-2003 was also project finance. It was auto finance is 96–97–98. There are always pockets and that is what we worry about the most that can it happen in SME and at that time our idea is that a) it should not be a large part of our book and b) can you scale back? Actually even in structured credit in 2008 we had a Rs. 1,100 crore book. By end of 2008 it became Rs. 400 crore. We shrank back that book in that time because of the market volatility post Lehman. So the ability to manage your risk and shrink it back is equally important. I remember I was talking to Uday Kotak and he said in 1999–2000 when all NBFCs failed, Kotak survived and one of the reasons is that they scaled back their business.

Wholesale credit book and NPAs:

If you analyze the NPA issue going on in the banks right now, which is mostly on the wholesale side, but 80% of the NPA issue is around project finance and frauds. So if you take the frauds like what is happening in REI Agro what happened in Deccan Chronicle and all of that, and if you take the project finance whether it is power, whether it is coal, whether it is mining, whether it is roads because approvals didn’t come, projects were over invoiced or whatever else were the reasons, 80% of the problem is project finance. Quite a few of our senior management started our career in project finance and even 25 years ago project finance was always risky. Project finance is never without risk in India and one of the reason all of us have avoided it is because at 13–14% interest rate you are not getting compensated enough for that; there is no risk reward in project finance but you can get scale in project finance easily, you can put Rs. 1,000 or 2,000 or 5,000 crore to work in the project finance opportunity quickly to gain scale. But if you avoid project finance, then wholesale credit books or corporate credit books even in IndusInd Bank, Kotak, Deutsche Bank etc. are not doing badly. So anybody who avoided project finance and frauds has been ok.

Real estate financing:

One of the other significant changes that has happened is, banks are becoming more conscious of risk based pricing. This entire NPA mess is forcing banks; banks are also saying I am not going to give money at 12-13%. So anywhere, normally these real estate guys would borrow from a non-bank at 100–200 basis points higher than they can get in the bank because bank has all these other issues. The banks are now starting to push this out of the banking part and your largest risk in real estate developer financing is execution risk. When you do a real-estate residential project, and we do only post approvals so usually there is no approval risk. If you take approval risk you can get a higher yield but if you do post approval, your only real risk is execution risk. It is not price risk at that level. You are 2x collateralized and unless there is a real estate collapse like an Asian crisis happens in India and suddenly the real-estate fall by 50–60 % which is not something that we think can happen in India given the way the economy is. In fact it has been improving. In the last one year even housing market has started to crawl back. Commercial real estate improved one year ago and this quarter housing also did really well and again, over the years I have seen one thing, the way night follows day, real-estate market follows stock market. So, if the stock market is going to be robust for the next couple of years, because real-estate market has not gone anywhere for 7–8 years, this is the biggest de-risking that has happened. Commercial yields are starting to inch-up but again idea is not to be too optimistic. Select your counter parties very carefully. If you get good counter parties and your collateral is good, you are ok. Some projects will be slower so your project execution risk may be there. The whole market of real- estate residential developers’ credit is about Rs. 100–120,000 crore market per year. HDFC is about Rs. 40–45,000 crore, Indiabulls is another Rs. 17-18,000 crore, Ajay Piramal’s group is about Rs. 14–15,000 crore and we are a Rs. 5,000 crore in that and that’s a fairly good market. Not a lot of people have lost money in that. The project have got stuck but on the credit side very few cases of default.

Profitability in urban home loan& LAP segment eroded:

We all NBFCs talk to each other and you know people who are handling products they are friends all over. Currently there is no stress building up. Their profitability has eroded from the home loan market. So home loan, especially urban salaried home loans, there is no profitability. We are not seeing increase in NPAs in that. In fact metros have becomes fairly competitive on both LAP and home loans but the tier 2 tier 3 cities we are not seeing stress getting to build up beyond what is the normal range and it is partly analytics and partly also the craziness that we saw even in the home loan market in 2008 with 100% LTV and all are anyway not allowed any more. We are not seeing that kind of behavior. In fact underwriting discipline has still been fairly good and partly aided by the fact that people are able to grow without making compromises. It is not like 2008–09 where you had to make compromises in terms of your underwriting standard to grow. It is not just our experience, when we talk to everybody and you all will also know that people are saying that we are not getting the push to scale back the standards. In fact if you saw our LTV, it has only come down. So we are not seeing it but it is a worry that should always be there and you should constantly look out for that.

Economic incentive for banks to sell NPA’s to ARC business:

ARC will continue to grow for the next couple of years because the banks usually sell the assets after the second year because the provision impact is the most after the second year because they provide 15% in first year, 30% in second year and goes upto 100% soon. The irony is that very often, the NPAs are not beyond recovery. If I gave to you home loan and it became NPA, it won’t become zero and eventually one should be able to recover 30, 40, 50 percent. For the bank it makes a lot of sense to sell to an ARC even at 40 cents to a dollar and avoid the last 40-50% NPA provision because once they sell it to ARC, then they don’t have to provide anymore.

[My Note: This explains the excitement around the ARC business with slew of partnerships between indian entities like SBI, ICICI, Kotak, Piramal and foreign capital providers.  If you are interested in understanding the business model of ARC – better read pages 29-31 in the transcript].

III. About Edelweiss business lines:

Credit and non – credit approach:

There is something that we are trying to implement in a different way. We believe having a good mix of credit and non – credit is the way to build truly a very scalable kind of a model. Most of the NBFCs are very credit oriented and credit is obviously the big part of the opportunity. Obviously currently credit is very hot but over a long term we have seen India growing the way other economies have grown and having the non-credit side of equation also gives you a balance and gives you a lot more sustained profitability.

Game plan for building the retail book:

We see lot of opportunity in Retail mortgage, agri & rural financing, SME business. Most of the verticals were started about 3–4 years ago and we are still understanding. Our strategy has been to take 4-5 years to understand the segment and then you start scaling up. As I said, at our size we can afford these things. So our whole idea is thinking like a bank having about 5–6-7 sectors where we can keep on reallocating capital.

Going through the grind while building business:

We started hiring people for our retail finance business, in 2011–2012. We were very clear that retail would take 8–10 years to build. So I do think that even now retail business in Edelweiss is under stated in the profit because we are still in the investment phase. We started our retail credit business in 2011 and only this year we have hit 10–11% RoE. We think it is a 20-22% RoE opportunity. Scale matters a lot because we have studied all the retail finance service companies and your cost income ratio and your scale are inversely proportional. What we say in all retail businesses you have the front book and the back book and the acquisition cost of the front book is what impacts your current P&L and the back book is what really adds to P&L. All retail finance companies invest a lot in building the back book and it takes you 8–10 years to build the back book and you have to go through the grind. We started this in 2012 and from 2012 onwards it has been good growth and we are still continuing to invest in retail. We do feel confident that as the retail is getting scaled up, there is still a lot more opportunity in front of us.

Game plan for non-credit side:

On the non-credit side we still have a high cost to income ratio of 74% and on long term basis we think we should be 50–60% because as you get scale it improves. But currently we are investing in building scale so we are growing fairly fast. We want to grow this business at a Net Revenue level at 35– 40%. It still makes only 22% RoE, usually non-credit should be between 30– 40% RoE. We think it will be another couple of years away before we get that scale to start generating or eking out or harvesting the profitably out of this.

Game plan for Insurance business:

On a long-term basis, to build an insurance company, you need to have agency model. If you look at most large good insurance companies around the world over the last 40-50 years, you will find very few companies, which have been built around the banca model. But the problem with agency is that it is expensive and it is a drag on your profitability, capital and cash flow. However, on a long-term basis, the profitability of selling traditional products through agents is the highest. So in a way, you are buying a new more fuel-efficient car which is very expensive. So you are spending a large amount upfront, but you get the returns over the long term.

Balance sheet management:

We also focus a lot on liquidity cushion because as you know we are not a part of a large industrial house or a large business group. In that sense we operate like a standalone bank with a large part of assets in treasury. Our ALCO focuses a lot on liquidity management and in fact the liquidity guidelines that we internally follow are the Basel 3 guidelines. We have almost 9% of our assets in unencumbered cash assets available to us on an overnight basis. We are able to do this because we have a treasury approach to this which most of the NBFCs do not have, though they are starting to build now.

Warehousing and Agri commodity financing business:

The reason we are in agri services (Warehouse & collateral managment) is because we want to build agri credit business and we have realized that without an agri service as an arm you can’t build an agri credit business, as your risk will not be easy to manage. Agri financing is usually short-term, it is usually between 3 months to maximum 1 year, because a lot of this are self liquadating assets. So our whole strategy is we become warehouse managers & collateral managers, and after that we fund goods which are in our warehouses. We believe it is an very innovative robust model for financial intermediation in commodities.

Warehousing industry is getting organized and we have WDRA (Warehousing Development and Regulatory Authority). Eventually warehouses should be like NSDL– CDSL. If there are goods lying in the warehouse then you can be certain that the goods are there and they are clean and that is where India needs to go. The good news is that the warehousing industry especially for agri is starting to get organized. Lot of the PE money is starting to go into this segment, which is the first indicator that this is getting organized and all are high quality companies that are getting built. This is a 5–10 year trend.

Screen Shot 2016-08-25 at 9.32.19 PMFairfax paid Rs. 1,100 crore for NCML with 1.3–1.4 million tons capacity and they make about Rs. 28–30 crore PAT and they paid almost 40X of that because they see opportunity there.

All banks are keen to do this (agri credit). Our estimate currently is that this is a Rs. 100,000 crore credit opportunity for the organized market and currently banks do anything between Rs. 20–40,000 crore and this keeps on fluctuating because ultimately a warehouse receipt business is a risky business and in the past ICICI had issues, all banks have had issues, NSEL is another one, because we are still not at a stage where a warehouse receipt is something you know that the goods are behind it as we all have found out after NSEL. An organized warehouse manager is something that banks want and banks are appointing others and us as collateral managers. There is a feeling that the WDRA is going to impose capital adequacy norms on the warehouses managers, which will be good. It is in the proposal.

We are not into warehousing and logistic business. We started doing a little bit of agri credit, built our first Rs. 100 crore book then realized that there is a lot of risk management required when the goods are lying in the third party warehouse. Hence we stopped that and went back to drawing board, which took a lot of time to convince our board. On a long-term basis we don’t see ourselves as a warehouse manager; we just had to do it. Coincidently we may have ended up building a standalone good business but our long term idea was that if there is a warehousing logistics management opportunity we will go on that part and we will be sponsors of that but we wanted to use that base for building an agri-credit business as our attempt has always been to find credit opportunities where you are not competing head-on with banks because banks have a cost of capital advantage. The idea is to find things where you don’t compete with banks but you collaborate with them. A lot of the Agri credit we are doing we expect that about a third of that will be priority sector. So now a lot of banks come to us saying can you help us expand our agri portfolio? We don’t want to do farmer loans but here biggest thing is the collateral is in your control because if it is not in your control then risk multiplies manifold. Unlike a car which has its identification or a house which has an identification, a bag of wheat has no identification which is the biggest risk at the end of the day in this particular sector. If that risk is conquered, this is a Rs. 100000 crore market and think about it, for 4% spread on Rs. 100000 crore market is Rs. 4000 crore. Opportunity is out there and it is a fairly big one. All banks, a lot of global financial institutions want to come and partner with us.

Looking forward to your thoughts and comments 🙂. My twitter handle (@eeswardev).
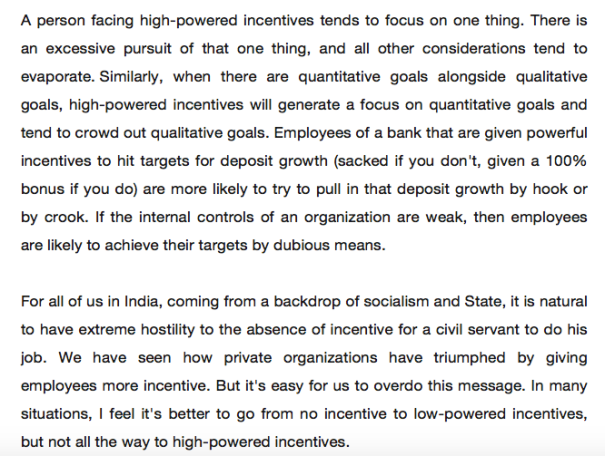
 

Things I Learned about Chit funds and Rural Savings

Don’t worry, I am not going to bore you about ‘Ponzi schemes’ like Sharada chits masquerading as ‘Chit funds’ :-). Instead, I want to talk about the real chit funds where group of like-minded people from the same community join their hands together for savings and borrowings. Investments in chit funds are very popular in southern states like TamilNadu, Andhra pradesh, and Karnataka. It is one of the important financial instrument in rural India (where people still hate to deal with arrogant bankers) and yet very few people understand it. Given the way chit funds are structured (See the Image below), it cannot declare about the returns an individual is likely to make in advance. Final returns varies depending upon the financial needs of all the participants. In contrast, most ponzi schemes (like Sharada scam, 1996 TN chit fund scam etc.) are deposit schemes that offer eye-popping interest rates, cash prizes, and gifts for deposits with the chit funds.

During my recent trip to India, I caught up with my friends and as usual talks veered towards savings and investment. Most of them invested in local chit funds and yet nobody have any clue about the returns it generates. Hence, out of curiosity i got data from couple of friend’s chit fund investment and attempted to put a number on it.

[Note: I have fascination for chit funds from very early age. My father would say that he met all his life obligations like his sister’s marriage, his marriage expenses, my grandpa’s medical emergencies, our education expenses were met solely through this type of monthly chit fund investment. He might have invested in some 40-50 chit funds in his lifetime. He used to take us to the community auction spot where group of 20 to 30 people used to gather, pool their money, and bid for it. In our small town, most people might have invested in atleast 2 chit funds at any one point of time].

How chit funds works?

Screen Shot 2016-07-18 at 3.28.14 AM

R Thiyagarajan of Shriram group built a formidable chit fund business. Shriram chits was started in the year 1974 and currently it has an AUM of 13,500 crores serving around 22 lakhs customers in 4 states (TN, AP, KN, and MH). In the newly released book, he noted the uniqueness of the chits and its role in the financial inclusion of rural household.

“Indian psyche is attuned to the concept of saving money. Every household and every individual want to save money and at the same time is also nervous if his savings will be adequate to meet his needs. Where will he go if he is unable to have his needs met? The chit somehow gives him an impression that as he saves, he also has protection.

The advantage in the chit business for a person who has been a member is that he has the right to take the money. The only concern is whether he is able to offer enough discount, so he doesn’t have to depend on anybody’s willingness to help him. It is his right and it preserves his self-respect to a large extent. So the peculiarity of this instrument, of its being able to be a saving instrument and double as a lending instrument means he doesn’t have to go about requesting the chit fund company to lend him the money. In fact, he can go demand it. That makes him feel very comfortable.

These things should be understood and appreciated and the government should make some modifications in the regulation of the chit fund business. Chit funds as an instrument could play a very useful role in achieving the government and the community’s objective of enhancing financial inclusion”.

Real Life example #1:

This chit fund was run by local finance professional. It is very similar to the chits run by Shriram, Margadarasi chits etc.

Number of people: 20; Auction: Monthly; Number of months: 20; Investment: 25,000; Pot money: 5 lakhs (20*25,000); 5% commission: 25,000 (5% commission is like fund management fees which goes to the person who runs the chit. He shoulders all the responsibility for the chit money and its monthly collection). Auction starts at 4,75,000 (after 5% commission) and the person who bids the lowest get to take the money home. For example, in the 1st auction, Person A places lowest bid at 3,58,000. Hence the divisible money for the group members will be 4,75,000-3,58,000 = 1,17,000. It is shared among all the 20 members as interest/dividend (1,17,000/20 = 5,850). And the same process repeated for 20 months.

Screen Shot 2016-07-21 at 11.32.15 AM
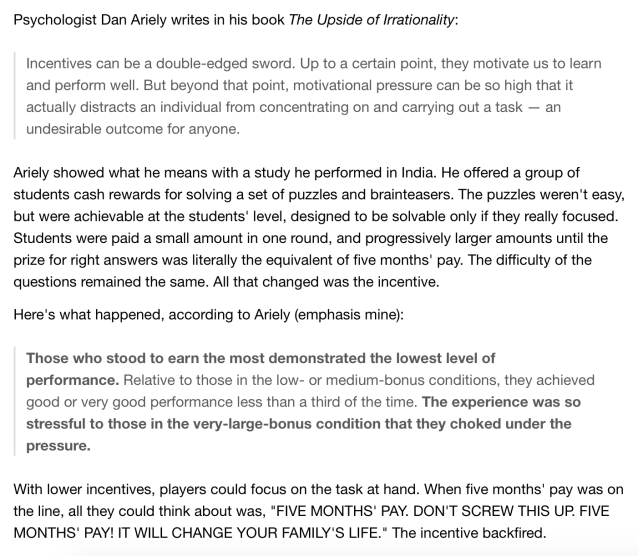
[Note: I filled-in best possible guess for the future auction in August and September 2016. In October, there will not be auction as last person standing will get to take 4.75 lakhs].

From savings perspective: If a person’s whole motive of investing in chit fund is savings, he will not bid in any of the auction and likely to take the final pot money of 4,75,000. To get this final corpus, he invested around 4,43,000 over the period of 20 months i.e. 22,150 per month on average. I didn’t want to complicate by feeding these monthly numbers into excel sheet and calculate IRR. Instead, i flipped and asked what else he could have done if he had not invested in chit funds. Recurring deposit is the only other option for the monthly investment. SBI and post office offers interest of around 7.5% quarterly compounded. 22,150 monthly investment for 20 months will fetch 4,73,250. Here, chit fund did slightly better. Returns worked out to be 8% compounded quarterly. [A little anecdote from my friend’s mom: She can’t do math and doesn’t have much needs apart from education expenses. Hence she never called any auction in her 25 years of chit fund investments and will always take the final pot money].

From lending perspective: Most people invest in chit funds in anticipation of future funding needs. It can be education fees, business funding needs, or unanticipated medical emergencies. Recurring deposits will allow to withdraw only 90% of the corpus you invested so far. On the other hand, in chit funds you can borrow against your future payments which were agreed at the start. If a person calls money in any of the first 3-4 auctions, the interest rate works out to be around 24-25% which is roughly the same most credit cards charges i.e. he gets around 3.6-3.75 lakhs and pays back 4.43 lakhs (22,150 per month over 20 months as EMI). Most people avoid them unless they are in emergency situations. From 5th to 8th auctions, interest rate will work out to be 15-18% and so on.

Chit funds flexibility: 

Amazing feature of the chit funds is its flexibility nature. It can be both lending and savings instrument at the same time. Also you can tweak the rules in the way you want. In the above example, chit fund was run by a finance professional whose whole job is gathering people, taking risk, and running chit funds. In the local community, sometime people will run the chit fund for the lower commission structure (say 2%, 2.5% or 3%) or sometime without any commission at all (see the example below). Also, there can be weekly, bi-weekly, monthly, once in 3 months kind of chit funds. Sometimes, people run chit fund in the name of god and spend all the money collected as commission (5%) for the community festival.

Real Life example #2:

This is local community chit fund in which another friend invested. Here the rules are little different and hence returns are better.

Number of people: 21; Auction: Once in 3 months; Number of months: 60 i.e. over 5 years; Investment: 10,000; Pot money: 2.1 lakhs (21*10,000).

It has 2 important tweaks:

  1. Commission is Nil. However, as the chit fund runs for 5 years, there is a real chance that someone might die/fall into a situation where they cannot continue further. Hence in the first meeting, everyone will pool 10,000 and save that pot of money (2.1 lakhs) for future unanticipated emergencies. Real auction starts from the 2nd installment [I was really amazed at this risk mitigation step!!].
  2. If a person calls an auction, he is no longer eligible for the dividend/interest from the divisible money (i.e. pooled money – Auction value). Hence with each auction, number of participants decreases for divisible money. This ensures steady dividend/interest throughout the chit lifecycle and hence the returns are higher as seen below. [In the earlier example, people who called auction, are barred only from future auctions but eligible for the dividends/interest from divisible money].

Screen Shot 2016-07-21 at 4.07.06 PM

As the chit fund runs without commission, returns are better. Also borrowings also works out 3-4% less than the example#1. In the example#1, the risk is borne by finance guy whereas in the example#2, the risk is borne by the community.

Key learnings for me:

  1. People in tier-2/tier-3 towns are already sensitized to variable returns. Hence it is a myth that people don’t invest in equity mutual funds due to the uncertainty in the future returns. Rather the problem lies in the sales team who push the MF product at wrong time with unrealistic return expectation.
  2. Most people in rural India intuitively understands that lower the commission, better the deal. However, due to the muddled thinking of our regulators, MF players fleece investors with high expense ratio of 2.5-3%.
  3. Instead of looking down this financial product, people need to recognize chit fund flexibility as savings & lending instrument and the role it plays rural savings culture.

To be clear, am not advocating that people should go out and invest in chit funds. In fact, chit fund culture it is not present in many states. Also there is problem with unscrupulous players who may flee with the corpus. In fact, it is better not to invest in chit funds unless you have strong bond with the community and you are familiar with the counter-party you are dealing with.

Following is the suggestion i gave to my friends during the trip: I did not want to confuse them with asset allocation and re-balancing stuff. Typically, Debt allocation were met by mandatory employee provident fund/contributory provident fund. Short-term funding needs will be met by the local community chit funds which gives debt mutual fund like returns. Gold allocation will be met by the gold that comes with marriage. Hence i insist them on mutual funds (specially ELSS with 80C benefits) only for the retirement corpus and ask them not to touch for next 20-25 years.

Please let me know if i had made any mistake in the excel calculations. Looking forward to your thoughts 🙂

How short-termism wrecks a company – An imaginary tale

As i noted in my first blog post, I was always curious to know how some of the high-growth market darlings goes belly up in few years time. I am more interested in business failures. I strongly believe that avoiding stupidity in investment process will yield long-term above-average results. As Charlie Munger famously quipped, “Just tell me where I’m going to die, so that I won’t go there”. Recently I was intrigued by the spectacular collapse of PE-backed fast-growing education company (lets call it as Company “T”) which operated in pre-schools and K-12 education segment. Also it was one of the rare cases which did not involve debt (as mostly would be the case for spectacular collapse). Hence i wanted to delve deeply.

Background: Company “T” started its first pre-school in 2003 and was founded by first-generation entrepreneur. In 2008, its business model caught the attention of a high-flying US-based Private equity “M” which recently started its operation in India. Over the next 4 years, it pumped 63 crores [35 crores (2008) + 15 crores (2010) + 9 crores (2011) + 4.2 crores (2012)] and the company “T” expanded furiously to 240 self-operated + 62 franchise pre-school centers and 24 K-12 schools. Company followed capex heavy self-operated model as against market leader’s franchise based model. Each pre-school center on average costs about 40 lakhs and it charged fees between 20,000 to 60,000/- per kid.

In August 2011, Company “T” came out with IPO and raised around 112 crores from the public. In FY 11, its total income was 41.15 crores and posted a net profit of 9.2 crores. As expected, Investment bankers, PE investor, and management priced the IPO issue at astronomical price (50x its diluted FY 11 earnings!!!). IPO had a poor stock market debut and ended 14% below issue price on Day 1.

Everything went fine until FY 13. Following was its financials at FY 13:

The average life span for most PE funds are around 7 years. Most of them will focus on exits starting 4th/5th year of investment. Due to this institutional imperative, I believe PE “M” shifted its focus from building the company to exiting its investment sometime towards the end of FY 13. It held around 25% of the company “T” and naturally started to worry about ways to exit. Being a 750-crore small-cap company with low liquidity in stock exchanges, selling the stake to other deep-pocketed institutions such as mutual funds, Insurance companies, other PE investors etc. was the only option left. At the same time, company “T” was still in investment mode and needed huge cash due to capex heavy self-operated model. Following is the imaginary conversation between CEO the company “T” and PE “M”:

After FY’13 annual results:

Company “T” CEO: We had good FY’13 – almost 50% growth on revenues and net profit. To maintain growth momentum, we may need more money some time next year for further expansion.

PE investor “M”: Sorry, we are already in the 5th year of our fund cycle. We can’t pump any more funds into the company. We have to start exiting our investments over the next 2 years. While we are scouting for potential investors, please execute high growth at any cost!!! 

After FY’14 annual results:

Company “T” CEO: Due to poor economic conditions and high inflation, our growth moderated in FY’14. Being an consumer discretionary item, our pre-school revenues grew only 20% and due to higher expenses, our net profit was almost flat when compared to last year.

Fy14-1

PE investor “M”: We already have hard time in finding potential suitors due to the rupee crisis. It is only since the Jan 2014, things started to look better. In addition, company need additional funds for future expansion. We can’t publish this horror results at this time. Lets “window-dress” company accounts to make it look better. Lets book additional 20 crores of revenue under ‘revenue from K-12 schools’ which are anyway going to accrue over the next 3 years. As costs are already incurred, this additional revenue will flow directly into the bottomline. Still we get cash from those schools, they will be hiding as receivables in the balance sheet. Most investors including smart money is more focussed on P&L statement, rather than on balance sheet and cash flow statement. This will be win-win for both of us: It will help company to raise additional funds and at the same time helps us to exit investment. 

FY14-2

Screen Shot 2016-06-06 at 5.19.02 PM

Company “T” Trade receivables from its FY2014 Annual Report

Company “T” CEO: Is it ethical? Will it not cause trouble?

PE investor “M”: It is well within accounting standards and besides everyone does “window-dressing” of accounts. Also before fund raising event like QIP, it is important to weave a story that the company is a big proxy for the multi-billion dollar education services sector and pull some regular PR stunts to make it a ‘hot fancied stock’ in the market. Give regular interviews with peppy numbers bandied around, also give ads to business channels (although it doesn’t make sense to advertise in business channels – it creates necessary visibility about the company among investors) etc.

Status of cash flow by FY’14: Company”T” showed 18% increase in pre-tax Cash flow from operations (CFO). Most of the times looking at standalone pre-tax CFO figures will mask underlying truth as changes in one or more heads will distort the picture. Hence i always try to look at pre-tax CFO/EBITDA which showed detoriation in FY’14 (Ideal ratio would be around 80-100%). [Note: Each year company “T” was paying variable fixed deposit amount to K-12 schools for securing exclusive rights. It masked original picture of CFO from operations. Hence i presented adjusted figures by including those fixed deposits].

Postscript:

On cue, the stock was pumped from 220/- to 500/- just before QIP. In Dec 2014, it fixed its QIP price at 440/- and raised around 200 crores from marque investors.

Screen Shot 2016-06-05 at 8.17.32 PM

At the same time, PE “M” sold sizeable stake to a insurance company for 50 crores in Feb-March 2015 and some more in open market for another 50 crores in June 2015. It was left with 12% stake.

But the luck didn’t last long for the company. In Sept 2015, proxy advisory firm raised concerns on company’s high receivables. It opined that receipt of fees in arrears is ‘rare and an exception’ in the education business the company operates in. It also raised questions on company’s fee collection mechanism and accounting system. Although the company’s management replied to the satisfaction of the proxy advisory firm, people lost faith on the management and stock price tanked relentlessly.

Screen Shot 2016-06-05 at 8.39.00 PM

During the mayhem, PE “M” also dumped its residual 12% stake in open market 2nd and 3rd week of Feb, 2016 and bailed out. However, First-gen promoter who left holding the bag was clueless and didn’t know what hit his company. Company “T” released its tepid FY’16 numbers marked by provisions and write-offs. Its net profit nose-dived to 6 crores from 60 crores in FY’15  and its debtor days climbed to 100 from 20’s in FY’13.

According to me, following are the key learnings from this episode:

  1. P&L statement is one of the least useful tool to analyze company’s strengths. It can be easily manipulated. Focus more on the balance sheet and cash flow statements to assess true strength of the company. Sudden raise in receivables should warrant further investigation.
  2. PE investors comes with institutional constraints and sometimes their short-termism nature can cause havoc in the company.
  3. Institutional investors often labelled as smart money is mostly ‘dumb money’. They too fall for fancied stock and behaves pretty similar to normal retail investors.
  4. Always be aware of any vertical movement in stock price before fund raising. More often it is management hand-in-glove with manipulators at work (If you got still doubt, would recommend reading Moneylife magazine for more case studies).

Note: This is my reading based on the sequence of events unfolded. It may or may not be true. So take it with pinch of salt!!! Looking forward to your comments and suggestions.

Indian Banks – Part II

Tags

, ,

In Part-I, I shared my preliminary analysis of PSU banks loan book. Even if the PSU banks overcome the bad assets and recapitalization woes, its future growth potential appears less than optimistic due to the recent advances in the technological innovation around banking industry.

Broadly there are 3 vital pillars in managing financial services and each of them undergoing profound changes:

  1. Facilitating Transactions – Fintech companies will make this vertical more and more commoditized. Most manpower in PSU banks are dedicated to this vertical whose relevance will wane in future.
  2. Pricing ‘risk’ – Fintech companies are trying to break open this vertical with models, artificial intelligence, data analytics etc. However, we all know what happened last time when financial world used models to price the risk [Hello 2008 :-)]. They have to undergo atleast one financial cycle to prove its worth. Local knowledge and real world judgement on pricing the risk will still be crucial.
  3. Workforce skill-set – Managing human resource, providing training in evolving technologies to improve customer service and to manage risk are very important. This is an area where large private sector banks has an definitive edge over PSU banks and even some of the smaller old-age private sector banks.

Private sector banks: 

Lets first look at the loan books of private sector banks and weed out poorly-managed banks to arrive at the shortlist for further analysis. As i said in part-I, I considered Net NPA’s and restructured standard assets net of provision as bad assets. 

Larger Private banks:

Large Pvt - NW and Bad assets


Screen Shot 2016-01-17 at 4.26.02 AM
We can clearly see why HDFC bank always trades at premium. It has got ultra-clean loan book with paltry bad assets. Bad assets of ICICI and Axis bank constitutes approximately 25% of its Net Worth. Quality difference in the loan book between HDFC bank and ICICI & Axis is clearly visible.

Smaller private banks:

Small Pvt - NW and Bad assets

Small pvt - bad assets to advances

Small pvt banks - NW to bad assets
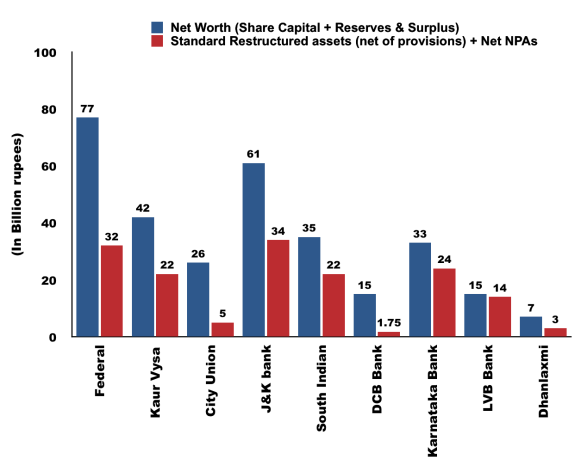
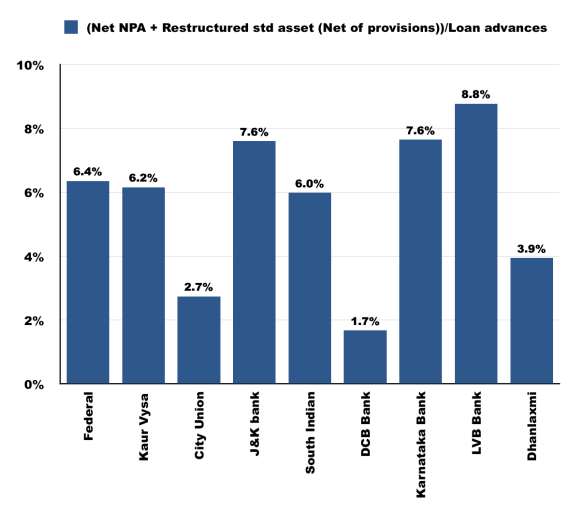
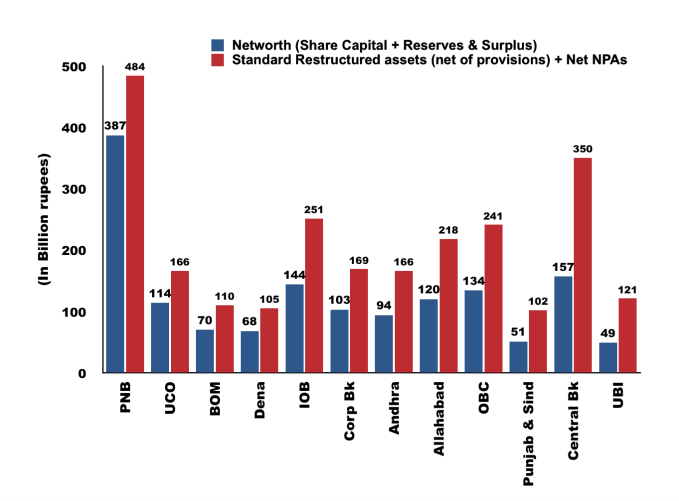
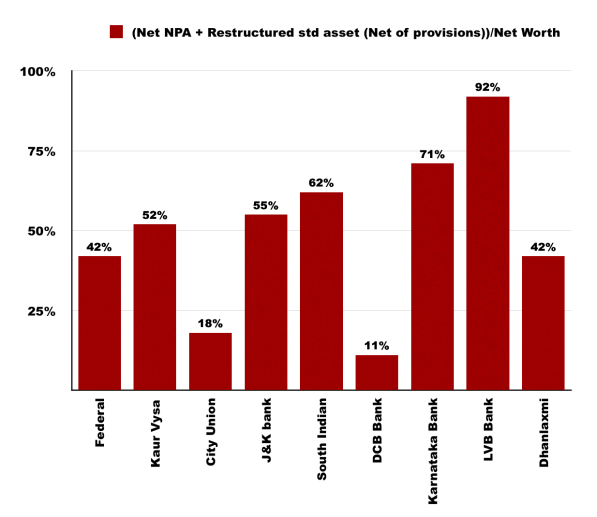
[Note: For example, in the case of Federal Bank, bad assets constitutes 42% of its entire Net Worth].

Debacle of Dhanlaxmi bank is well-known and hence lets exclude it. Except, City Union bank and DCB bank most of them are afflicted with bad loans problem. Barring these exceptions, bad assets constitutes 6-8% of the bank’s loan advances. It will hobble them for a while and higher than usual equity dilution can’t be ruled out.

Key points from long-term investing perspective:

  1. Better not to look at the PSU banks further, except SBI. In addition, probably SBI is the only PSU bank that has strong presence in asset management, insurance and investment banking vertical. Added it to watchlist.
  2. Among larger private sector banks, HDFC, Kotak, IndusInd, Yes bank needs to be delved deeply.
  3. Although Axis and ICICI bank are hobbled by bad assets, they have excellent retail banking franchise. Added both of them to watchlist – will closely monitor developments on asset quality front.
  4. Given the huge potential of financial sector in India, couple of smaller private banks may break out from the pack. DCB and City union bank needs to be analyzed further.

I attached private sector bank’s data excel sheet. Feel free to download and play with the numbers. Let me know if you come across any mistakes or interesting observations [Note: All the numbers are collected from individual bank’s FY 2015 annual report. I used only standalone numbers for comparable purpose. For Kotak-ING combined, i took FY’15 Kotak bank standalone + FY’15 Kotak Mahindra Prime subsidiary (which does car financing) +  FY’14 ING Vysa (FY’15 annual report is not available due to merger)].

Looking forward to your thoughts. Cheers 🙂

Indian Banks – Part I

Tags

, ,

Traditionally, i avoided financial institutions due to the inherent leverage in its business model. Considering its immense potential for wealth creation, recently i started taking baby steps towards analyzing indian banking sector, its growth drivers, and future potential. In this two-part series, i will document some of the interesting things i learned (Don’t worry, i am not going to bore you with all the financial jargons in analyzing financial stocks 🙂 Rather i would like to pen down some of the ‘aha’ moments  during the learning process).

Indian Banking structure:

There are 27 public sector (PSU) banks and 20 private sector banks in India. However, majority of the assets and loan advances are controlled by PSU banks.

Slide1.jpg

[Source: FY 2015 Bank Annual reports. Data excludes unlisted banks such as State bank of Hyderabad & State Bank of Patiala (PSUs) and Catholic Syrian bank & RBL (Private banks)]

Balance sheet: 

Understanding bank’s balance sheet is very crucial. Following is the snapshot of Federal bank’s balance sheet. Screen Shot 2016-01-16 at 8.03.37 PM

Liabilities side is dominated by bank’s Net Worth (Share capital + Reserves & Surplus), bank deposits, and market borrowings.

Assets side is dominated by Investments (Treasury operations) and Advances a.k.a loan advances (both corporate and retail loans). Loan advances are further classified into standard assets and non-performing assets (NPA). NPAs are loan accounts that are not paid for 90 days.

Generally bank’s Net Worth is levered (varies with each bank – approximately 8-12 times) with borrowings (bank deposits & market borrowings) to provide loan advances. In the above example, loan advances of Federal Bank is around 6.6 times its Net Worth. In other words, its entire Net Worth will be wiped out if 15% (1/6.6) of its loan advances turn bad assets and becomes not recoverable. Banks are generally valued at multiples of its book value (i.e. Net worth) depending on the bank’s return ratios and management’s capabilities. Before attaching multiples to Net Worth, we need to  ascertain ‘true’ Net Worth by quantifying standard assets and bad assets.

PSU Banks:

Instead of shortlisting good-performing banks, i inverted the process. First, i wanted to eliminate poorly-managed banks that contains lot of bad assets. Because more the bad assets, lesser will the ‘true’ Net Worth. I considered Net NPA’s and restructured standard assets net of provision as bad assets. I collated each bank’s Net Worth, Gross NPA’s, provisions for NPA’s, Net NPA’s, restructured standard assets (according to me, they are nothing but glorified NPA’s that are ever-greened due to lax attitude of regulator & bankers), provisions for restructured standard assets from its FY 2015 annual report. Lets look at numbers of 24 PSU banks loan advances in two separate sets.

First set of PSU banks:

Good PSU banks - NW &amp; NPA

[Note: I removed SBI from above the chart as its assets are huge and skews the graph. Hard data: Standalone SBI’s Net Worth – 1284 bn and bad assets – 676 bn (Net NPA – 276 bn + Restructured std asset net of provision – 400 bn). But incidentally it has one of the better-managed loan book among PSUs as seen in the charts below. Its bad assets forms 5% of the loan advances only and its Net Worth is approximately twice that of bad assets].

Good PSU - Bad assets to loan advancesGood PSU - Bad assets in percentage
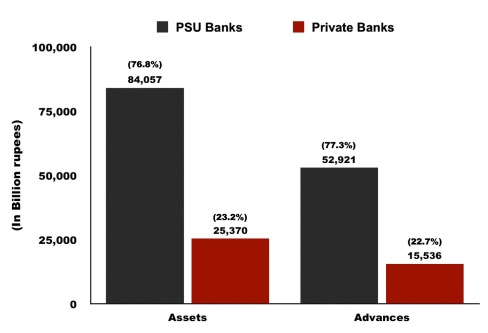
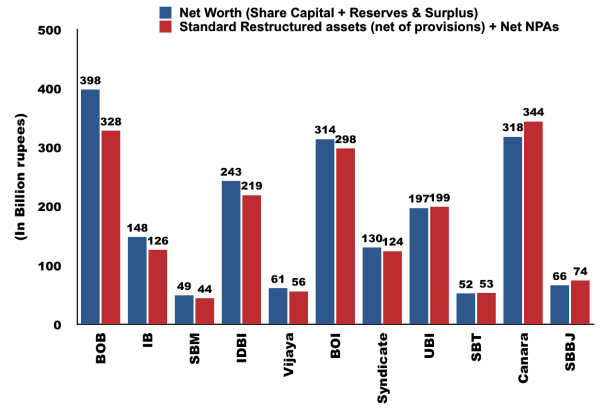
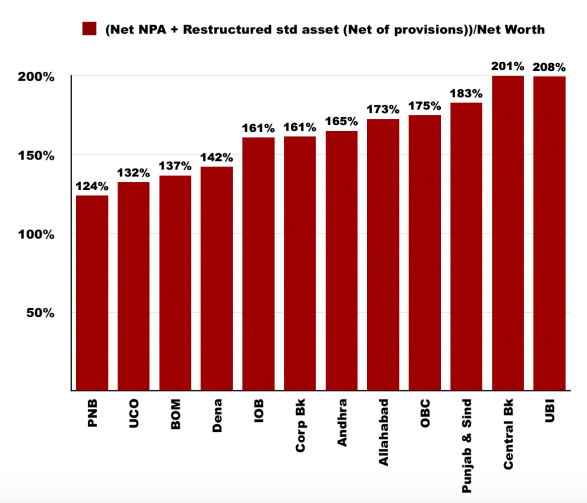
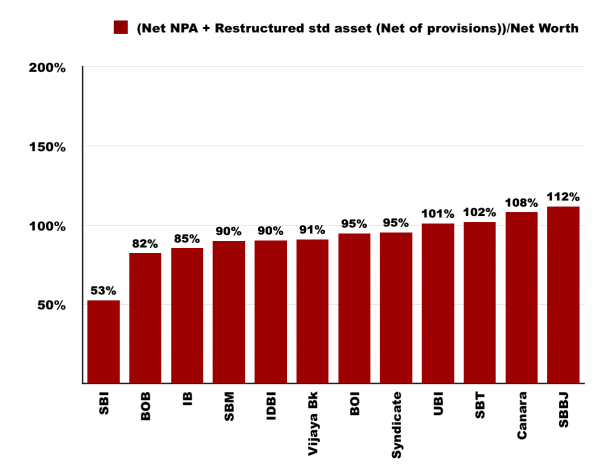
[Note: For example, in the case of SBI, bad assets constitutes 53% of its entire Net Worth].

Second set of PSU banks:Bad PSU - Networth & NPA.png

Bad PSU - Bad asset to loans

Bad PSU - bad assets in percentage
[Note 1: For exampleUBI’s bad assets is 2x its Net Worth. If it takes a 50% hair cut out of its bad assets (highly unlikely), its entire Net Worth will be wiped off].

[Note 2: In my twitter page, i shared my preliminary analysis. Here i inverted the ratio to provide better picture. Also, Numbers here are slightly different due to inadvertant minor error. Restructured loan book contains assets from both standard asset and NPA accounts (Thanks to @deepakshenoy for pointing out). I corrected it and included only restructured assets of standard loan book & Net NPA’s for the calculation of bad assets. I also netted of any provisions against those restructured standard assets. Still the numbers are scary 😮 and doesn’t change broader picture much].

As you can see from the above pictures, loan book of SBI and its associates are relatively (Only relatively !!!) better than other PSU banks. Some of the smaller PSU’s like  Allahabad bank, Oriental bank of commerce, Punjab & Sind bank, Central bank of India, and Union of India are in dire straits with bad assets/loan advances >15% and its bad assets constitutes 1.75-2x Net Worth.

Equity dilution:

Equity dilution is principal enemy for the long-term investors in banks. PSU bank stocks are beaten down so much. There could be short-term 30-50% jump depending on developments such as marginal improvement in stressed sectors, extension of leniency by RBI or government package etc. But i am more interested in the long-term wealth creation and being novice in the market, i don’t have the ability to predict on the possible short-term movement. For me, putting finger on the bank’s ‘true’ Net Worth is crucial.

Lets be clear on one thing: None of the bank’s Net Worth is going to ZERO. Either government will re-capitalize or it will merge with relatively better PSU banks. Principal question: What will the hair-cut to the bank’s Net Worth due to the bad assets? According to CRISIL ratings, historically, about 35-40% of the restructured accounts have eventually defaulted. Lets be charitable and factor in 25% haircut.

In addition, bank needs additional capital of 25% to meet Basel-III recommendation and also to meet additional provisioning requirement due to RBI’s change in rules. In total, there is a real probability of approximately 40-50% equity dilution for long term investors.

Based on the above analysis, i eliminated all the PSU banks except SBI. I would re-examine them when all the things like recapitalization settle down. In recent times, i became very skeptical of turn-around stories. Being contrarian is very different from being contrarian & right. Success stories of turn-around stories are filled with survivorship bias. Generally investors who became contrarian early in a turn-around story are not alive to tell their story. My thumb rule for turn-around stories: Have a starter position – Let the management execution & business profitability determine your position size and not your wishful thinking. I would like to stick to this rule even if it means leaving some profits on the table.

In the part-2, i will document some of the interesting things i learned about the private sector banks and technological innovation in banking industry.

I attached data excel sheet. Feel free to download and play with the numbers. Let me know if you come across any mistakes or interesting observations [Note: All the numbers are collected from individual bank’s FY 2015 annual report. I generally don’t attach much to quarterly reports and analyst presentation – lot of things are swept under the mat. 2 Quarters were passed – some of the banks might have raised equity capital, sold bad assets to ARC, or recognized more bad assets – Please keep that caveat in mind].

Looking forward to your thoughts. Cheers 🙂

Conundrum of Steady-growth Vs Turnaround themes

Tags

,

Earnings growth is one of the important determinant of wealth creation. Broadly there can be 4 situations that favor occurrence of high earnings growth.

  1. Value migration – Value migrates from outdated business model to new ones. For eg: Value migration in IT and Pharma sectors from western world to low-cost countries; value migration from public sector to private sector banks
  2. Sustained industry tailwind – Sectors catering to the growing, aspiring population in India – like FMCG, consumer durables, quick-service restaurants, autos, housing finance, construction related materials like sanitary ware, tiles, electrical goods etc. Here wealth is created by companies that are dominant/market leader (top 3) in the segment or by niche companies with unique business model that created the market segment.
  3. Turnaround due to operating leverage – Disproportionate increase in earnings due to one/combination of the following conditions: new large investment getting commissioned, change in business mix, improvement in under-performing business vertical, change in management.                                                     
  4. Turnaround due to  financial leverage – Disproportionate increase in earnings due to one/combination of the following conditions: Sale of non-core assets, Sale of loss-making subsidiary, raising fresh equity to reduce interest cost.

Over the years, Motilal Oswal wealth creation studies have shown that there is higher probability of wealth creation in secular growth themes such as value migration and sustained industry tailwind in Indian context. But most of the time, we investors are more enamored with the turnaround themes than the secular growth stories. Warren Buffett famously quipped in 1979 letter that “Both our operating and investment experience cause us to conclude that turnarounds seldom turn”. Following is edited excerpts from the annual report of Crompton Greaves (one of the company i followed closely in recent years), which is undergoing business re-structuring.

Excerpts from FY 2013 annual report:

“The restructuring exercise started in FY 2012 continues and is part of an on-going process of globalization of CG. Full fledged restructuring for creating a greater and more efficient global footprint takes time. There is no reason why your company’s global management team cannot effect the turnaround in FY 2015, and deliver better results for the shareholders”. “Results include Includes Exceptional items of one time Belgium operations restructuring costs of Rs. 229 crores“.

Excerpts from FY 2014 annual report:

“I am happy to state that your company’s restructuring has started delivering better results. Sales grown by 11.5% and PAT have more than trebled to Rs. 258 crores”. “CG has done better than last year. But it is the beginning of the climb back to the top. We will get there – perhaps faster than we think”.

Excerpts from FY 2015 annual report:

“In my last year’s letter to you, I wrote “that your Company has started delivering better results” and expected “better days ahead”. Regrettably, this has not happened in FY2015. On consolidated basis, Net sales grew by 2.8% and PAT was 20.2% lower”.

“Unfortunately, the overseas business has affected your Company. Revenue from overseas operations decreased by 0.6% to US$ 1,023 million in FY2015. Operating EBIDTA posted a loss of US$ 6 million. And because of some significant one-time charges (170 crores) and additional provisions, losses at the PAT level deteriorated from US$ 40 million last year to US$ 83 million in FY2015″.

Even the management tend to underestimate the time taken to restructure and turnaround business operations. Note the one-time exceptional charges which are recurring :). Over the years i realized that for the turnaround theme to work, lot of moving parts have to align perfectly (except in the case of new large investment getting commissioned)  making it a low-medium probability event.

Recently, I came across 13 top picks of analysts for the CY 2016 in Outlook Business magazine. 10 out of 13 analysts (77%) picked turnaround themes. Only 3 out of 13 (23%) chose franchise business which can compound steadily. I classified their investment thesis based on the earnings growth category mentioned above. (Note: Average 3 year ROE > 15% is classified as well-run business and Average 3 year ROE < 15% is classified as poor business. In an ideal scenario, i would have preferred ROCE when compared to ROE to eliminate the impact of debt. Data Source: Moneyworks4me.com).

Average 3 year ROE < 15%:

Dalmia Bharat: 

3 Year average ROE: 1.4%; FY 15 ROE: -1.12%; Debt to Equity: 2.74

Investment case: Turnaround due to operating leverage (better realization due to consolidation of competition, volume growth, cost efficiency).

Delta Corporation:

3 Year average ROE: 2.25%; FY 15 ROE: -2.75%; Debt to Equity: 0.44

Investment case: Turnaround due to operating leverage (New large investment getting commissioned at Daman) and financial leverage (non-core asset sale expected).

Jain Irrigation:

3 Year average ROE: 4.7%; FY 15 ROE: 4.94%; Debt to Equity: 1.98

Investment case: Turnaround due to Operating (better business performance expected in recently diversified business verticals) & Financial leverage (raised equity and better working capital management is targeted).

TATA communication: 

3 Year average ROE: Negative (loss making in FY 13 and FY 14); FY 15 ROE: 6.78%; Debt to Equity: 40.67

Investment case: Turnaround due to Operating leverage (higher contribution from enterprise telecom vertical) and financial leverage (debt reduction due to sale of SA subsidiary).

Force Motors:

3 Year average ROE: 5.22%; FY 15 ROE: 7.25%; Debt to Equity: 0.02

Investment case: Turnaround due to change in business mix going forward (Higher contribution of component business expected).

Trent: 

3 Year average ROE: 0.58% (loss making in FY 13 and FY 14); FY 15 ROE: 8.6%; Debt to Equity: 0.08

Investment case:  Turnaround due to operating leverage (better performance expected from women’s clothing brands like westside and JV with Zara, closure of struggling Landmark and stabilization of JV with TESCO in hypermarkets).

Astec Life Sciences:

3 Year average ROE: 8.54%; FY 15 ROE: 11.88%; Debt to Equity: 0.73

Investment case: Turnaround due to operating leverage (Change in management – takeover by Godrej group).

Wockhardt: 

FY 15 ROE: 12.49% (Believe no point in looking at 3 year average ROE due to US-FDA ban on plants); Debt to Equity: 0.55

Investment case: Turnaround due to operating leverage (Better performance from high-margin US export business vertical due to the expected removal of US-FDA ban)

VA Tech Wabag:

3 Year average ROE: 14.02%; FY 15 ROE: 12.69%; Debt to Equity: 0.06

Investment case: Turnaround due to operating leverage (Higher order off-take expected from domestic water treatment vertical and turnaround of low-margin International business vertical which faced significant headwinds)

Voltas:

3 Year average ROE: 14.23%; FY 15 ROE: 17.37%; Debt to Equity:0.00

Investment case: Turnaround due to operating leverage (Higher demand for ACs expected due to impending 7th pay commission and OROP and turnaround in electro-mechanical vertical performance)

Average 3 year ROE > 15%:

Ashapura Intimates:

FY 15 ROE: 24.36% (listed recently); Debt to Equity: 1.76

Investment case: Sustained industry tailwind (in inner ware and lounge ware + Valentine brand)

Bata India:

3 Year average ROE: 25.18%; FY 15 ROE: 22.57%; Debt to Equity: 0.00

Investment case: Sustained industry tailwind (in footwear market + Good brands)

Jubilant Foodworks:

3 Year average ROE: 26%; ROE: 18.57%; Debt to Equity: 0.00

Investment case: Sustained industry tailwind (in QSR segment + Dominos & Dunkin Donuts brand tie-ups)

Following are the reasons i believe investors tend to choose turnaround themes over steady compounding machine. Consider following scenarios mentioned in most investment thesis in the magazine:

Scenario 1: This turnaround candidate will double in 3 years

Scenario 2: This franchise business will compound steadily over time

  1. Framing effect: Scenario 1 is far more exciting than the scenario 2
  2. Illusory of control: People tend to choose ‘certainty’ in the CAGR returns of turnaround candidates (mostly people say that it will double in a specific time frame) over ‘uncertainty’ in the returns of steady compounders (mostly people will refrain from giving number)
  3. Most investors including experts fail to see steady compounders as small incremental changes tend to go unnoticed (Charlie Munger called this phenomenon as “boiling frog syndrome“).

I am not advocating that we should abandon turnaround stories and load up on steady-growth themes. Both of them has a place in the investor’s portfolio. Well-judged turnaround story even in a commodity business will work wonders.

My learning: We need to be aware of the base rate of success in the category and tilt our portfolio towards higher probability events. Because hope is not a strategy 🙂

Looking forward to your comments.

Vicarious Learning

Tags

,

Warm welcome to all. Following tweet from Rahul Bhangadia set my thoughts in motion:

Screen Shot 2014-11-15 at 3.12.45 PM

Charlie Munger famously quipped, “Just tell me where I’m going to die, so that I won’t go there.” What he’s really saying is, tell me how and why an investment approach fails, and I will learn how to improve upon it. I strongly believe that avoiding stupidity in investment process will yield long-term above-average results. I was really intrigued how 25% ROCE biz went belly up in few years time. Along with Hunang toys, I wanted to study some of the yesteryear market darlings that fell dramatically. Following is the list I could come up with: Arshiya Intl, Hunang toys and textiles, OnMobile global, Deccan Chronicle, Praj Industries, Blue Star, Opto circuits, Suzlon energy, Educomp. Broadly they fell into 3 different baskets: Outright poor business, Qualify as contrarian bets but quite opposite in hindsight and Apparently sound business but duds in hindsight. I wanted to learn some common themes which runs through these business so that i can try to avoid in my investment journey.

General financial parameters long-term investors look for soundness of the business are:

  1. Net sales growth (12-15%)
  2. Net profit growth (12-15%)
  3. Decent net profit margin (7-10%)
  4. Net Operating cash flow
  5. Consistent ROIC that exceeds cost of capital (12-15%)
  6. Debt to equity (< 0.5)

I. Outright poor business:

Arshiya International

Arshiya International – Very poor ROIC, Negative operating cash flow and rising debt

Hanung toys

Hanung toys & textiles – Erratic operating cash flow and very high debt

On mobile global

OnMobile Global – Very erratic and declining ROIC

Above companies are quite easy to skip as they don’t muster even the basic smell test for a sound business.

II. Qualify as contrarian bets but quite opposite in hindsight:

Companies in this basket are quite tricky. Value investors often take pride in telling the whole world how wrong they are by making contrarian investments in companies met with temporary setbacks. But making contrarian bets just for the sake of being contrarian would be quite counterproductive. In order to avoid pitfalls, value investors need to trend cautiously.

Blue Star:

Blue star

10 Year Snapshot

Company has great brand in consumer facing air conditioner market and all the financial parameters are picture perfect till FY’09. Stagnant sales and net profit in FY’10 can be dismissed as temporary blip. Quick search in internet would have yielded this blog post (written in 2006) from famed value investor Rohit chauhan. But the investment would have ended disastrous with price plunging from 450 to 150.

Blue Star

Blue Star – Price chart

Only parameter that might have saved us in the 10-year financial snapshot is deteriorating working capital days (keep this parameter in mind) starting FY’10. Rohit chauhan rightly pointed out deteriorating account receivables and inventory position.

Deccan Chronicle and Holdings:

Deccan chronicle

10 Year Snapshot

Until FY’08, Deccan chronicle had higher debt and erratic operating cash flows. With rapid reduction in debt and stabilizing operating cash flows, FY’09 annual report might have painted that the company is turning around the corner and better days are ahead. But the results would be equally disastrous.

Deccan Chronicle

Price chart

Only parameter that might have saved us is consistently high working capital days of the company. I remember equity master got burned on its recommendation of Deccan chronicle.

Praj Industries:

Praj Industries

Praj Industries – 10 Year Snapshot

It was an emerging player in ethanol space and Rakesh Jhunjhunwala had substantial stake in it. Till FY’09 it was sound in almost all the financial parameters. Drop in net sales and profit in FY’10 can be dismissed as minor blip. But the following 3 years turned out to be like this:

Praj Industries

Price chart

Actually market hold up until Jan 2012, but deteriorating working capital days combined with falling ROIC and net profits should have served as better indicator to dump the stock.

Therefore, before donning contrarian cap, we should check working capital days (with cutoff <175-200) of the company to ascertain soundness of the business. Simply put, Working capital days is the number of days that a company will take to convert its working capital into revenue. Working capital is a common measure of a company’s liquidity, efficiency and overall health. Please check out this video:

III. Apparently sound business but duds in hindsight:

Sure deteriorating working capital day’s parameter can save us from making dud contrarian bets. But what about companies with good all-round financial parameters in  sunrise sectors? Will this parameter be helpful to distinguish wheat from chaff? It seems “ yes” when we look at following images.

Suzlon energy:

Suzlon energy

10 Year Snapshot – Great on all 6 parameters until FY’08

Educomp Solutions:

Educomp

10 Year snapshot – Great on all 6 parameters until FY’11

Optocircuits:

Optocircuits

10 Year Snapshot – Great on all 6 parameters until FY’11

I am pretty sure that all of us know how investors fared by investing in above companies. All the three companies continued to excel in most of the financial parameters until the disastrous financial year that showed massive drop in profits. Check out the consistently high working capital days in all of them, which can serve as big and only red flag against investment in these companies.

Invert, Always Invert:

As Charlie Munger advises, lets invert the problem. Will dramatic improvement in working capital days along with other financial parameter point to better investment candidate? Lets look at Avanti feeds – see the dramatic improvement in working capital days in the past 3 years along with other financial parameters.

Avanti feeds

Avanti feeds – 10 Year Snapshot – Note the working capital days turnaround in Fy’10 and its further improvement over the years

Screen Shot 2014-11-15 at 8.18.16 PM

Price chart

It is same story in Atul Auto, Astral Poly, Symphony etc.

Exception:

Before using this indicator indiscriminately, we also have to look at exception. I observed pharmaceutical industry as a whole has long working capital days. It might be due to the inherent nature of business, which has long gestation period between the investment of manufacturing plant and cash generation. Hence we should always compare the company with industry leaders. Following is the snapshot of leaders in pharmaceutical industry:

Sun pharma

Sun pharma – 10 Year Snapshot – Working capital days hovers >200 

Reddy's

Dr.Reddy’s – 10 Year Snapshot – Note the consistent high working capital days 

In conclusion, I believe working capital days parameter is one of the important indicator to judge the soundness of the company and hence it should be added to the investor’s checklist. Specially it would be very useful in small caps and midcaps space where we would overlook company’s fundamental in our zeal to find next multi bagger. Along the way I am sure we may commit some mistakes of omission but not mistakes of commission which is a bigger danger any investor need to avoid.

[Source: 10 year snapshot from Moneyworks4me.com and price chart from Moneycontrol.com]