Warm welcome to all. Following tweet from Rahul Bhangadia set my thoughts in motion:
Charlie Munger famously quipped, “Just tell me where I’m going to die, so that I won’t go there.” What he’s really saying is, tell me how and why an investment approach fails, and I will learn how to improve upon it. I strongly believe that avoiding stupidity in investment process will yield long-term above-average results. I was really intrigued how 25% ROCE biz went belly up in few years time. Along with Hunang toys, I wanted to study some of the yesteryear market darlings that fell dramatically. Following is the list I could come up with: Arshiya Intl, Hunang toys and textiles, OnMobile global, Deccan Chronicle, Praj Industries, Blue Star, Opto circuits, Suzlon energy, Educomp. Broadly they fell into 3 different baskets: Outright poor business, Qualify as contrarian bets but quite opposite in hindsight and Apparently sound business but duds in hindsight. I wanted to learn some common themes which runs through these business so that i can try to avoid in my investment journey.
General financial parameters long-term investors look for soundness of the business are:
- Net sales growth (12-15%)
- Net profit growth (12-15%)
- Decent net profit margin (7-10%)
- Net Operating cash flow
- Consistent ROIC that exceeds cost of capital (12-15%)
- Debt to equity (< 0.5)
I. Outright poor business:
Above companies are quite easy to skip as they don’t muster even the basic smell test for a sound business.
II. Qualify as contrarian bets but quite opposite in hindsight:
Companies in this basket are quite tricky. Value investors often take pride in telling the whole world how wrong they are by making contrarian investments in companies met with temporary setbacks. But making contrarian bets just for the sake of being contrarian would be quite counterproductive. In order to avoid pitfalls, value investors need to trend cautiously.
Blue Star:
Company has great brand in consumer facing air conditioner market and all the financial parameters are picture perfect till FY’09. Stagnant sales and net profit in FY’10 can be dismissed as temporary blip. Quick search in internet would have yielded this blog post (written in 2006) from famed value investor Rohit chauhan. But the investment would have ended disastrous with price plunging from 450 to 150.
Only parameter that might have saved us in the 10-year financial snapshot is deteriorating working capital days (keep this parameter in mind) starting FY’10. Rohit chauhan rightly pointed out deteriorating account receivables and inventory position.
Deccan Chronicle and Holdings:
Until FY’08, Deccan chronicle had higher debt and erratic operating cash flows. With rapid reduction in debt and stabilizing operating cash flows, FY’09 annual report might have painted that the company is turning around the corner and better days are ahead. But the results would be equally disastrous.
Only parameter that might have saved us is consistently high working capital days of the company. I remember equity master got burned on its recommendation of Deccan chronicle.
Praj Industries:
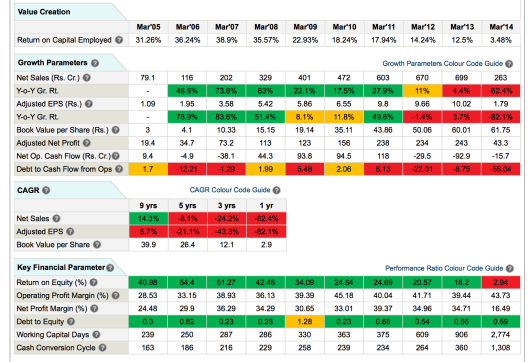
It was an emerging player in ethanol space and Rakesh Jhunjhunwala had substantial stake in it. Till FY’09 it was sound in almost all the financial parameters. Drop in net sales and profit in FY’10 can be dismissed as minor blip. But the following 3 years turned out to be like this:
Actually market hold up until Jan 2012, but deteriorating working capital days combined with falling ROIC and net profits should have served as better indicator to dump the stock.
Therefore, before donning contrarian cap, we should check working capital days (with cutoff <175-200) of the company to ascertain soundness of the business. Simply put, Working capital days is the number of days that a company will take to convert its working capital into revenue. Working capital is a common measure of a company’s liquidity, efficiency and overall health. Please check out this video:
III. Apparently sound business but duds in hindsight:
Sure deteriorating working capital day’s parameter can save us from making dud contrarian bets. But what about companies with good all-round financial parameters in sunrise sectors? Will this parameter be helpful to distinguish wheat from chaff? It seems “ yes” when we look at following images.
Suzlon energy:
Educomp Solutions:
Optocircuits:
I am pretty sure that all of us know how investors fared by investing in above companies. All the three companies continued to excel in most of the financial parameters until the disastrous financial year that showed massive drop in profits. Check out the consistently high working capital days in all of them, which can serve as big and only red flag against investment in these companies.
Invert, Always Invert:
As Charlie Munger advises, lets invert the problem. Will dramatic improvement in working capital days along with other financial parameter point to better investment candidate? Lets look at Avanti feeds – see the dramatic improvement in working capital days in the past 3 years along with other financial parameters.

Avanti feeds – 10 Year Snapshot – Note the working capital days turnaround in Fy’10 and its further improvement over the years
It is same story in Atul Auto, Astral Poly, Symphony etc.
Exception:
Before using this indicator indiscriminately, we also have to look at exception. I observed pharmaceutical industry as a whole has long working capital days. It might be due to the inherent nature of business, which has long gestation period between the investment of manufacturing plant and cash generation. Hence we should always compare the company with industry leaders. Following is the snapshot of leaders in pharmaceutical industry:
In conclusion, I believe working capital days parameter is one of the important indicator to judge the soundness of the company and hence it should be added to the investor’s checklist. Specially it would be very useful in small caps and midcaps space where we would overlook company’s fundamental in our zeal to find next multi bagger. Along the way I am sure we may commit some mistakes of omission but not mistakes of commission which is a bigger danger any investor need to avoid.
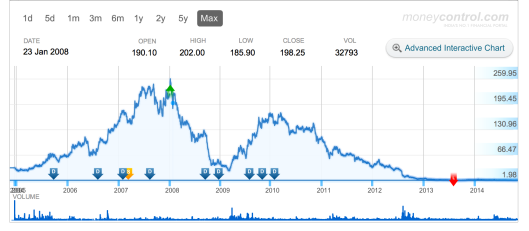
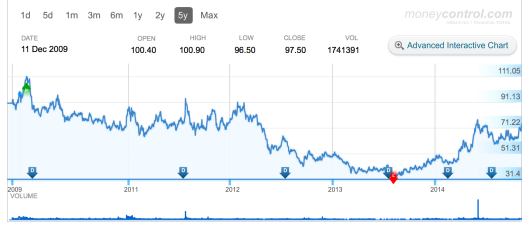
[Source: 10 year snapshot from Moneyworks4me.com and price chart from Moneycontrol.com]


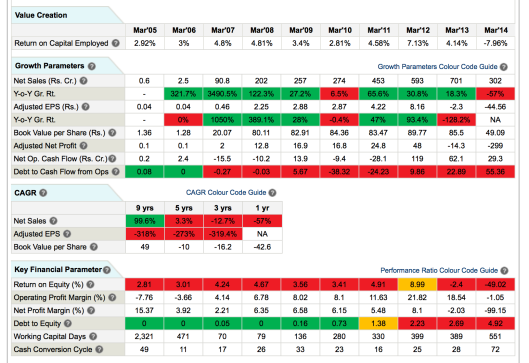


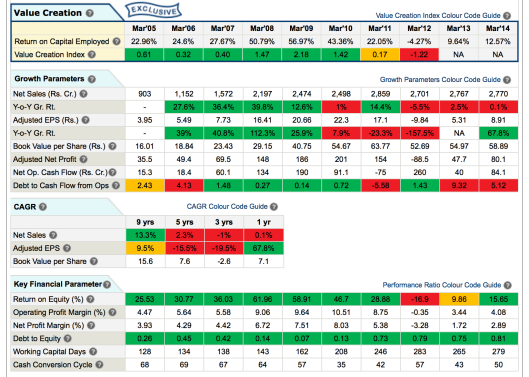







Credit period in export is higher than in domestic business. Since big pharma companies tend to do large amount of business outside India this explains high working capital. But it is compensated by higher margin. Also debt free balance sheet adds lot of comfort.
LikeLike
Along with higher credit period, their whole product cycle takes much longer time. Pharma business exporting to US need to plan 4-5 years beforehand, get it approved from US-FDA before ramping up the production. Definitely debt free balance sheet combined with high margin and free cash flow generation cushions the working capital needs.
LikeLike
u have considered stand alone numbers for arshiya please consider consolidated numbers. i burned my hand and money so would love to learn where things went wrong way.
LikeLike
hi
Nice post.iam curious where you got the value creation snapshots from ? which website ? or its something of your own creation?
LikeLike
Thanks. I used Moneyworks4me.com for the financial snapshots. I found their website to be very good to use for various parameters.
LikeLike
Pingback: How short-termism wrecks a company – An imaginary tale | Ant Investor